


Jeffrey P. Snider
My articles My offerMy siteAbout meMy videosMy books
Follow on:LinkedINTwitterSeeking Alpha
My colleague Joe Calhoun likes to remind me that markets and fundamentals only sound like they should be related, an observation that is a correct one on so many different levels. Stock prices, in general, and GDP growth may seem to warrant some kind of expected correlation, but it has proven quite tenuous at times especially in a 21st century sense. This divergence has sown a great deal of doubt and sometimes apathy in response. After all, stocks must be at record highs for some legitimate reason(s) no matter if the US economy is very far from the fundamental equivalent.
Given the global nature of particularly large cap stocks, that difference might have been in the past explained by the ability of US companies to capture growth outside the US. Obviously, that distinction no longer applies, meaning that the US economy’s struggles are perfectly timed and consistent with the global economy’s. Given that the two are bounded by the same factor, “dollars”, this is intrusive interpretation where it really shouldn’t be (nor have been the past few years).
The real economy unlike stocks is vastly more susceptible to the breakdowns of money and credit related to the decay of the eurodollar system. The eurodollar is not exhaustive of all global monetary channels, and thus it is entirely possible where one can seem to be pricing what is nowhere near the other. Shares have other more robust sources that just don’t apply to a real economy far more dependent upon the credit-based core of global money.
Corporate treasuries are not bound by eurodollar problems, especially given the bond market’s supply of a high liquidity bypass going back to the depths of 2009. Sovereign wealth funds as well as foreign central banks have also purchased US equities regardless of the fundamental conditions for them. But where they may be little to no economic relationship between stock prices and a reasonable fundamental analysis even in the intermediate term, there should be at least between economy and the fundamental starting point for them. The intersection between GDP and EPS, for example, is much more established and therefore offers a sound basis for making necessary comparisons.
If we are to relate share prices to fundamentals, it would be as an outlook into some undetermined future distance. In other words, record stock prices would be consistent with some good level of probability that the economy and therefore earnings will eventually move up in accordance; that prices are now correct and earnings will at some not-to-distant point grow into them. This is the mainstream view of stocks as seen by economists and policymakers adhering to the views of efficient markets and rational expectations, the discounting mechanism of information that leads the FOMC to at times fixate on the S&P 500 (and they know it).
That was certainly the market of 2013-14, where prices blew all balance with earnings that had paused in their recovery from the Great “Recession.” The 2012 slowdown in the economy was also a stock market event, at least where trailing twelve month EPS (as reported) for the S&P 500 peaked at $88.54 in Q1 2012 and then fell slightly for the next three quarters to a trough of around $86.50. That left the market a bit overvalued at 15 times ttm.
All that changed with the introduction of QE3 (and then 4), but only on the one side. Share prices exploded higher not as EPS growth did too, but rather in anticipation of the point into the future from which they would. Stock “investors” were buying up the high likelihood of the future fundamental economy pushing up future earnings to a level that would justify the pre-determined action in prices. Surely QE3 would work on the economy, so better to buy now and not wait for confirmation. Given the rhetoric surrounding “money printing”, far too many believed none was actually needed.
| There were, of course, more than a few problems with that expectation even at that time. The biggest was the already mounting opportunity cost of time, to which the slowdown in 2012 only added a great deal more. The most visible aspect of the rising economic cost can be found in the various orthodox calculations for economic potential. The increase in lost time meant that forward potential was reduced, and often considerably though stock “investors” either did not notice or did not care. |
S&P 500 EPS April 1996 - April 2016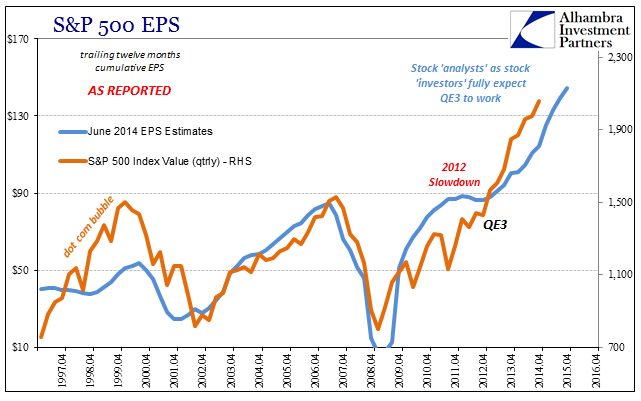 - Click to enlarge |
| The difference was all about probability. Analysts, as investors, judged (discounted?) a high degree of probability that fundamentals would in short order validate these expectations. By the middle of 2014, analysts figured EPS (ttm) for the S&P 500 would be about $145 for CY 2015, more than fair value for the index that at the time was still moving upward even after the prior year’s explosion in prices.
The mainstream view of the economy at that time further bolstered those predictions. The unemployment rate was falling fast, the BLS figured the start of a robust payroll expansion, and then GDP jumped to 4% and 5% for two consecutive quarters, all seeming to confirm the positive views for QE as more than impacting intangible expectations. And even though economic “potential” had been revised down, it still left considerable room for the current economy to produce global conditions that might have led right to $145 in earnings. |
CBO Counterfactual Recovery Q1 1999 - Q1 2021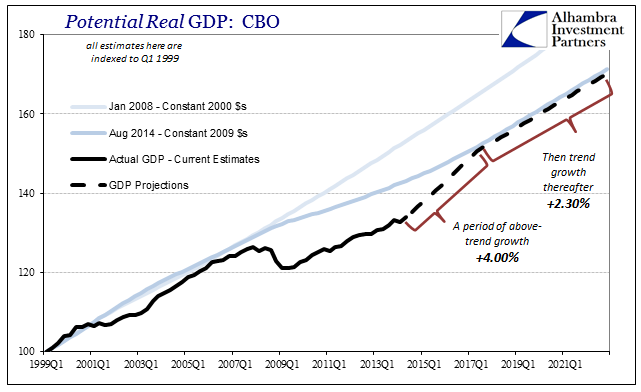 - Click to enlarge |
| If the output gap was about to be closed in the manner of true “full employment”, as it was proclaimed at the time, then 4% growth would have been the average for it and for several years until the output gap had finally disappeared (only then giving way to long run trend growth). From this view, QE as well as stock prices seemed somewhat reasonable.
Again, the primary problem was in fundamentally misreading and misinterpreting what QE was – it was not money printing no matter how many times the media repeats the assertion supposedly derived from the editorial standards for what constitutes good authority. What should have been considered to a greater degree was how these views on QE amounted to little more than confirmation bias. All the evidence to that point suggested QE wasn’t working and hadn’t worked, established strictly by the fact that there had already been a second years earlier (and then a third, and then a fourth). From this view, it was far less reasonable to expect EPS for the S&P 500 to ever get near $145. |
EPS CBO February 2017 - Click to enlarge |
| Of course it never did, as earnings for the index peaked at about $105 in Q3 2014. Over the next six quarters, EPS fell while investors struggled to make sense of both the decline as well as its duration. The most recent trough was Q1 2016, which conforms, not surprisingly, to the economic conditions that prevailed then and so far thereafter.
Having passed that trough, it appears investors are in a rush to make the same mistakes all over again. Like 2013, though to a much lesser degree of intensity, stock prices appear to be reflecting a very high probability that having moved beyond last year’s EPS trough it necessarily means earnings growth will be robust enough from this point forward to accomplish what earnings growth three years ago never came close to doing. |
EPS CBO February 2017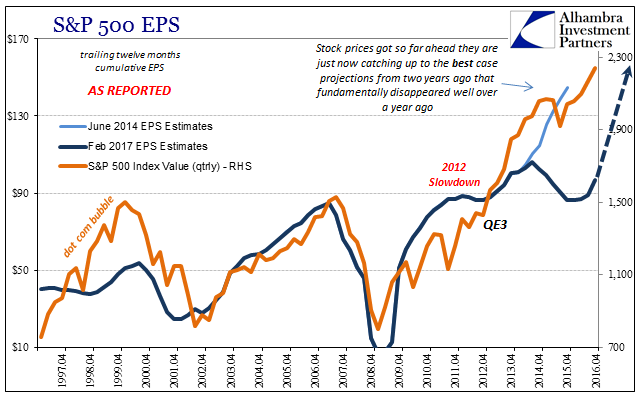 - Click to enlarge |
| This is where economic analysis is perhaps most helpful and in the same capacity as in 2014. Without some variance between the US economy and the global economy, the overall macro condition in the US applies as a proxy for the whole world (and may even represent the best of what are only bad cases). Thus, it is highly important that we note that officials all around the globe are acting as if the global output gap has closed. We do this not because they now figure that possible result, but rather because authorities are now confirming in their own way and on their terms what we long suspected about the economy (and agreeing to interpretation of it) – there will be no recovery. |
CBO Future Projected Q1999 - Q2021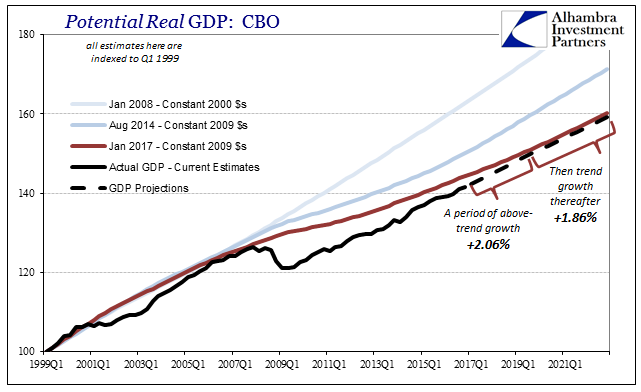 - Click to enlarge |
| This presents a vastly different scenario than the one set out by what officials, analysts, investors, the media, etc., believed in 2014. At that time, they had only in passing considered the massive economic damage done during the Great “Recession”, suggesting that damage as a function of time rather than baseline. What was left out, sometimes by intent, was more importantly that damage was (and is) still being done long after the “recession” supposedly ended.
Using these updated calculations that more accurately reflect fundamental economic conditions as they are, and therefore prospects, what is the real likelihood that we see EPS shoot upward to justify current (or even 2014) stock prices? |
EPS CBO SP500 Downgrades, January 2011 - April 2016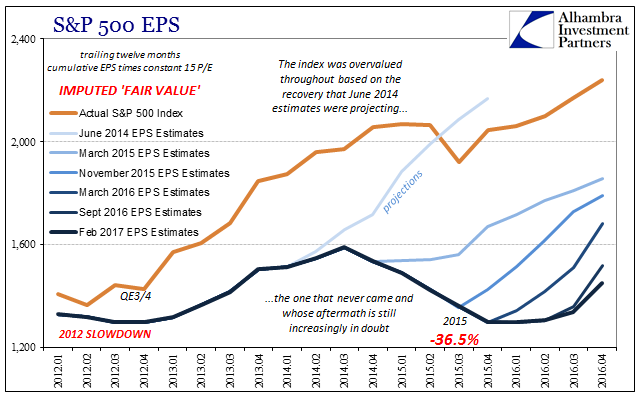 - Click to enlarge |
| Analysts’ estimates remain far too high given this troublesome background, essentially a no-growth baseline. And so quarter after quarter the rebound loses energy and momentum, a more accurate reflection of almost totally lost (global) potential. When Q4 started in October, EPS expectations were for $29.04, leading to a ttm figure finally back over $100. As of the latest update, where 86% of companies have reported for Q4, EPS is instead estimated to have been just $26.37 for the quarter and only $96.76 for 2016 as a whole.
The recovery in earnings is as lackluster as the recovery in economy, a more constructed relationship where stocks are concerned. That leaves share prices, in general, operating on the far end of the probability spectrum; where everything has to go just right in the near future, including whatever may come out of Trump “stimulus” and economic policies. EPS, however, suggests, as the calculations for GDP potential, that that would be a very low probability outcome, including a high risk of “something” going wrong all over again just like it was in 2014. |
EPS CBO SP500 Downgrades Recent, January 2011 - April 2016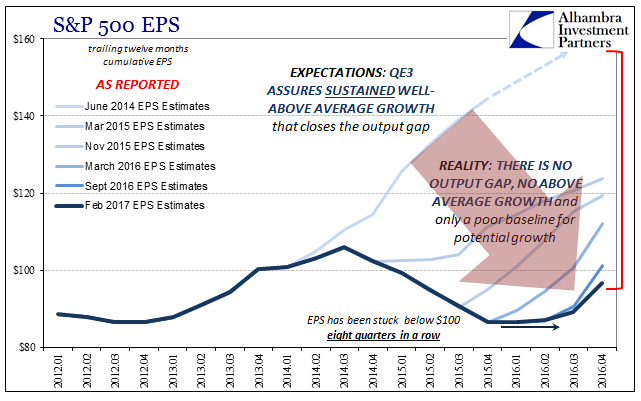 - Click to enlarge |
| If we can’t establish a solid link between the economy and stock prices, and we can’t, then we can at least posit a correlation between macro fundamentals and stock fundamentals. That leaves us with a departure point still around valuations and ultimately risk. |
EPS CBO SP500 Future, April 1996 - April 2018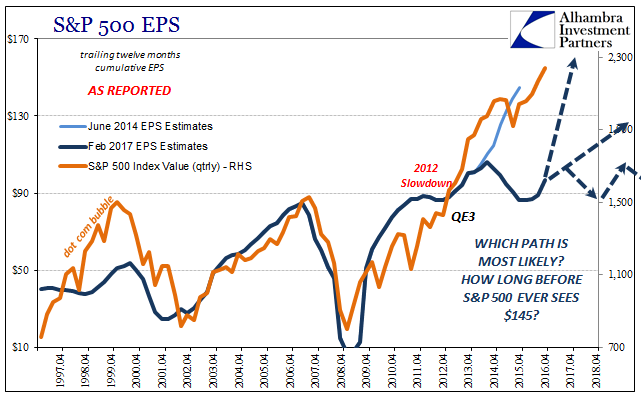 - Click to enlarge |
Tags: asset bubbles,cbo,currencies,depression,Earnings Per Share EPS,economic potential,economy,Federal Reserve/Monetary Policy,Markets,newslettersent,Output Gap,real GDP,recession,S&P 500,stock bubble,stocks,valuations


1 comments
zoran
2017-02-24 at 06:05 (UTC 2) Link to this comment
https://www.marxists.org/archive/marx/works/1844/df-jahrbucher/outlines.htm