Jeffrey P. Snider
My articles My offerMy siteAbout meMy videosMy books
Follow on:LinkedINTwitterSeeking Alpha
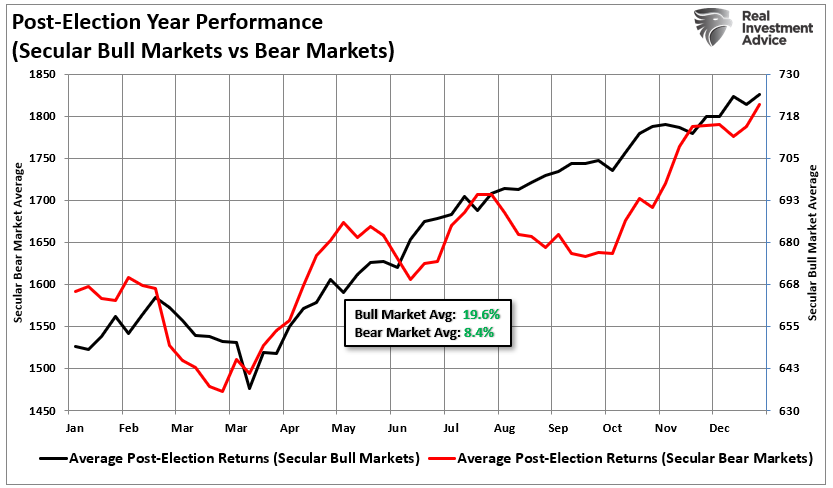
| If the economy is repeating the after-effects of the latest “dollar” events, and it does seem more and more to be that case, then analysis starts with identifying a range for where it might be in the repetition. New orders for durable goods (ex transportation) rose 4.3% year-over-year in January 2017 (NSA, only 2.4% SA), the highest growth rate since September 2014 (though not meaningfully faster than the 3.9% rate in November 2016). Despite the resumption of a plus sign, new orders in January were actually 0.01187% less than new orders recorded in January 2014. This is the most relevant standard for comparison, but is set aside in the sentiments created by resumed “growth.”
The current rate of expansion for both new orders as well as shipments places the manufacturing economy in parallel with where it was in early 2014. The year-over-year rate for durable goods shipments was 4.6% in January 2017, about equal to March 2014 which was estimated contemporarily to have been about 5.1% growth (subsequent benchmark revisions have brought estimates down to just +1.9%, something to keep in mind). That figure was released in late April 2014, and was consequently used as more evidence for QE’s potency. |
Durable Goods New Orders, NSA 1993-2017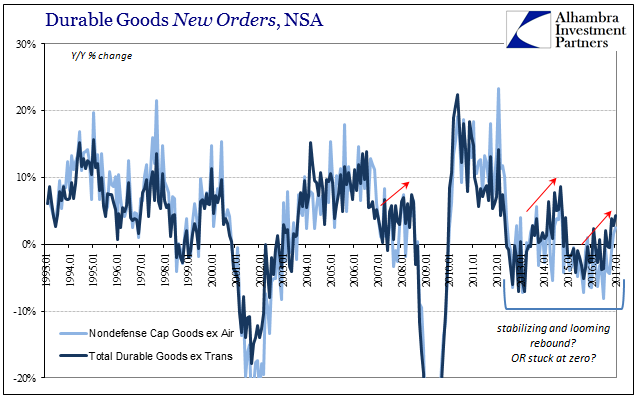 - Click to enlarge |
After grave economic concerns that abounded all over the world in late 2012 and 2013, the seeming acceleration in late 2013/early 2014 appeared to have suggested through traditional views the end of “transitory” weakness from which some good part was surely due to so much further monetary policy accommodation (QE3). Yet, despite so many in the mainstream who clearly wanted that to be the case, there was always something missing. I wrote at the time instead:
Whatever I might write about durable goods in early 2017 I already wrote about them in early 2014. That is not a good sign, as it is the worst case playing out as if the economy is stuck in a nearly infinite loop like Bill Murray’s character in the movie Groundhog Day. |
Durable Goods New Orders, SA 1993-2016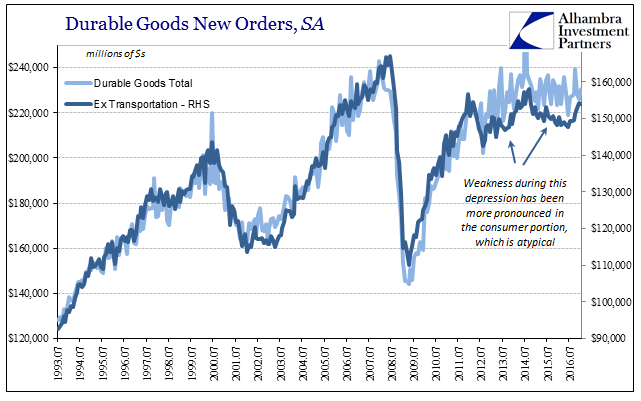 - Click to enlarge |
| In some ways, of course, the current version of the “rebound” is measurably worse by conventional standards, for in many parts it isn’t even close to a rebound. In terms of the durable goods report, activity related to consumer goods has improved in the past half year or so, but overall when including the transportation and industrial sectors there is literally no difference between 2014 and 2017. |
Durable Goods Total New Orders, SA 1993-2016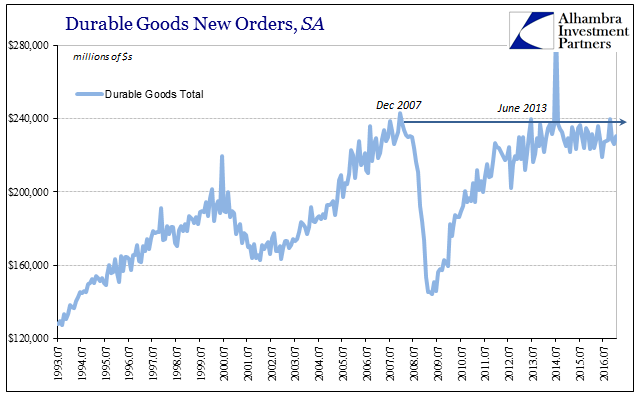 - Click to enlarge |
| This is the most relevant parts that are never included in mainstream “analysis”, where durable goods orders or shipments are today about where they were almost four years ago, which was equivalent in level to a decade ago. Because there is so much that simply echoes there is very little to suggest how the current economy might be meaningfully different. |
Non-defense Capital Goods ex Aircraft, Shipment 1993-2017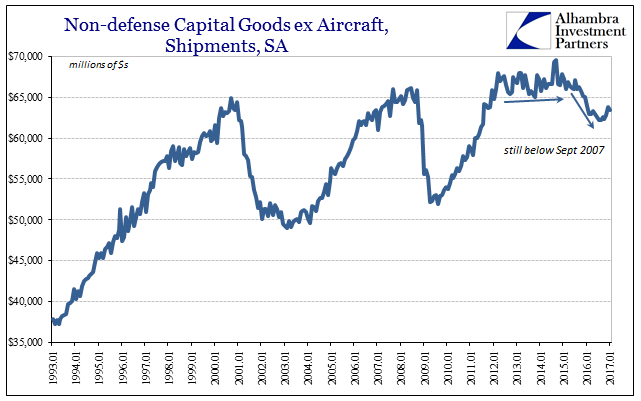 - Click to enlarge |
What changes is merely commentary and sentiment, the nature of modern humans who have been conditioned to attribute only positive feelings to economic accounts with plus signs – especially during periods following minus signs. In reality, the economy as demonstrated by durable goods as well as so many other accounts including retail sales hasn’t changed at all plus or minus signs. It is all just variable degrees of conspicuously small amplitudes wrapped around the same corrosive baseline of depression.
If there is a new pattern forming indicating something substantially optimistic, it should at least appear in great contrast to the 2012-14 period – but sadly does not.
And, sadly, still does not even though three additional years have passed. The economy of the past decade needs to be measured in terms of time and baseline rather than interpreted by the emotions of either plus or minus signs. Being infatuated with the confirmation bias of positive numbers had the effect, certainly on policymakers and the media, of leaving them totally unprepared for what followed 2014. Worse than that, it meant that they would remain committed to an interpretation that only became more implausible by the month, losing almost all credibility in the process.
Tags: capex,capital goods,currencies,depression,durable goods,economy,Federal Reserve/Monetary Policy,Markets,new orders,newslettersent,recession