Jeffrey P. Snider
My articles My offerMy siteAbout meMy videosMy books
Follow on:LinkedINTwitterSeeking Alpha
| Initial jobless claims fell to just 234k for the week of February 4, nearly matching the 233k multi-decade low in mid-November. That brought the 4-week moving average down to just 244k, which was a new low going all the way back to the early 1970’s. Jobless claims seemingly stand in sharp contrast to other labor market figures which have been suggesting an economic slowdown for nearly two years. Unemployment insurance claims, on the other hand, continue to move to lower levels than was reached in each of the five prior business cycles. |
Initial Jobless Claims, January 1967 - January 2017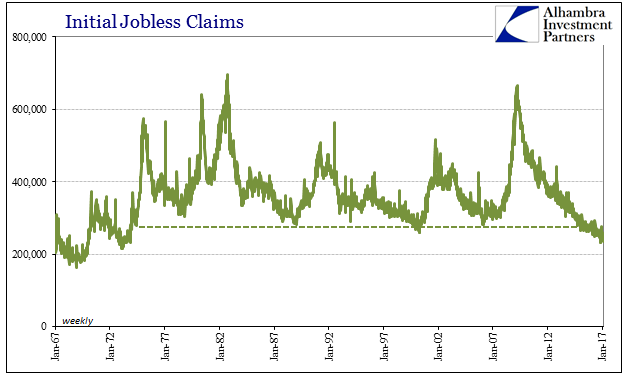 - Click to enlarge |
| The economy being what it is and this being nothing like prior cycles, there may not actually be inconsistency from among these results. In fact, there may be an explanation for the narrow variation in the overall US economy in the post-crisis, non-recovery era that the data for initial claims aids in establishing.
It starts with recognition that the level of UI activity has been declining for decades. Adjusting claims by either the Civilian Noninstitutional Population or the official count of the labor force shows that there have been far fewer relative unemployment claims than might otherwise appear from just the absolute figures. |
Initial Jobless Claims Population, January 1967 - January 2017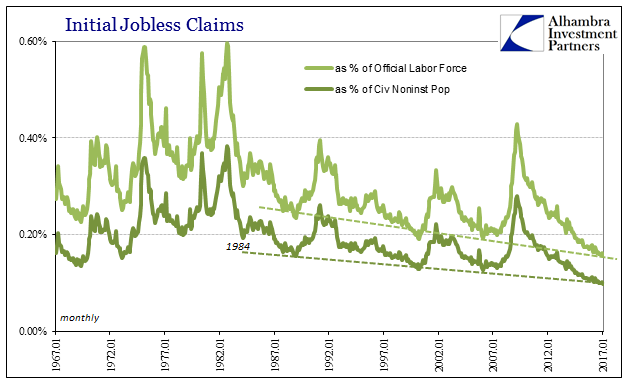 - Click to enlarge |
| Even during the Great Recession, the peak as a proportion of the population was nowhere near what it had been in recessions before the middle 1980’s. The reason for that is very likely one of the reasons the period between 1982 and 2000 (or 2007) was called (mistakenly) the Great “Moderation.” Prior, the US economy was driven by factors more so related to the industrial economy, where labor was more fluid with respect to the business cycle. Manufacturer’s, in particular, driven by often huge swings in inventory production and then liquidations would add employees to considerable degree during boom times and then shed them equally as fast at the onset of the next recession.
With manufacturing employment peaking in 1979, what replaced it in the overall labor market mix were jobs less susceptible to such wild business cycle swings. |
Factory Orders Many Payrolls History, January 1960 - January 2017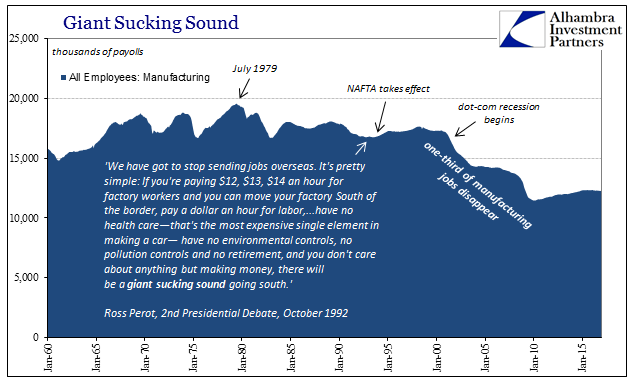 - Click to enlarge |
| That isn’t the only factor to consider, as a parallel trend has been like for inventory an unusual attention to the corporate cost structure unlike the decades before the 1980’s. Corporatism has certainly played a role in suppressing both volatility of labor in part as attention to the trajectory of labor costs throughout any cycle. It is a very well-known and established fact that labor’s share of overall economic output, or GDP, has been declining irregularly during this period. Depending upon how one attempts to measure the reduction, it either coincides quite well with the shift in jobless claims or predates it by about a decade. |
Labor Share of GDP Wages, January 1947 - January 2017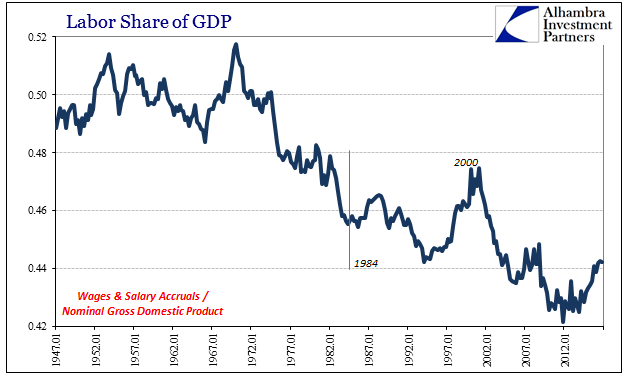 - Click to enlarge |
| The difference in the charts above is what is attributed as “labor’s share”; the first being only wages and salaries; the second including other forms of compensation beyond cash payouts. There are other means of labor income not included in either, which is where some debate takes place over the degree to which labor’s share has declined. Some have argued that if you take into further account taxation, for example, the difference becomes much less. |
Labor Share Compensation, 1951 - 2017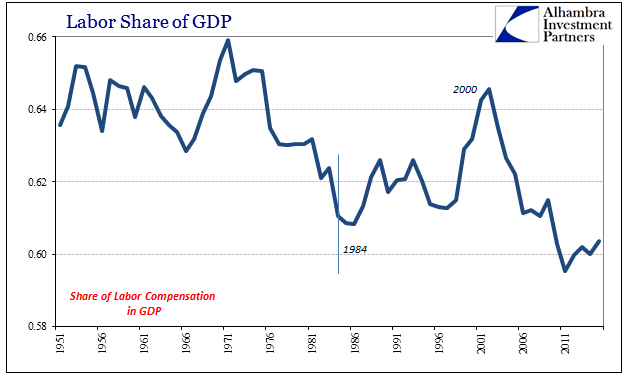 - Click to enlarge |
| Whatever the case, it is generally agreed that there has been some level of reduction which is in good likelihood significant. If we assume that one primary point of causation is corporatization and over-attention, so to speak, to the bottom line and cost structure, then the declining share makes sense but only if we can account for the topline, too. If businesses pay less (growth) to their workers, in the aggregate, that will eventually become less (growth) for their workers to spend. This is especially the case in the 2000’s where the redistribution of corporate income through asset prices and financial cash flows (share repurchases and dividends) rather than productive investment was reaching extremes. |
Household Sector Credit as GDP, January 1953 - January 2017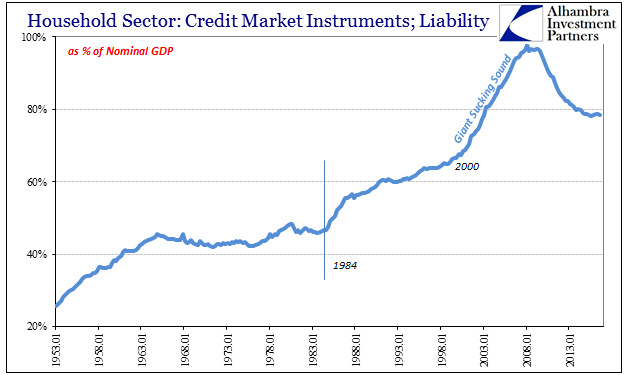 - Click to enlarge |
| There is no great mystery as to what that might have been. Consumer and other forms of credit attained by US households exploded after 1984, and then again to ridiculous extremes after the dot-com bust. It was during this time after 2000 where one-third of all the manufacturing jobs that were left in the US disappeared from the US. It was also here where the BLS records that as a dramatic change in the US economy’s labor utilization rate (as measured by total hours worked). |
Productivity Total Hours Screwed Workers, January 1965 - January 2017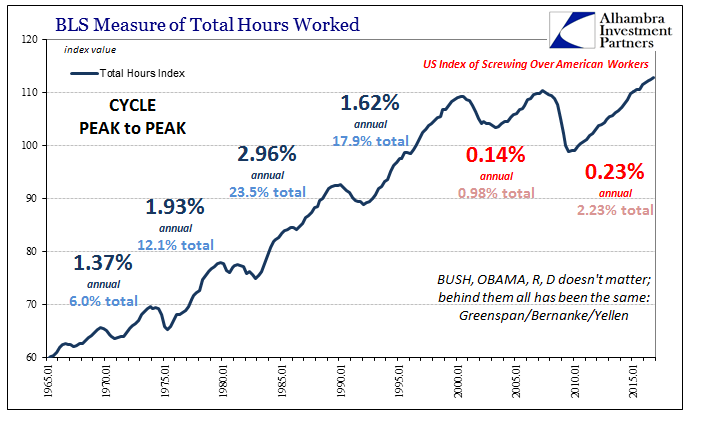 - Click to enlarge |
| So where labor’s share of output inarguably declined after 2000, the difference was made up in various forms of debt to an enormous degree. This clearly had drastic effects upon corporatization, overcoming the organic feedback mechanisms that had governed the relationship between labor and business for all economic history up to that point. In other words, in prior times if businesses paid too little they would impact their own revenue stream to the point which would cause an economic break, including recession. The business cycle would restart the process of rebalance as part of the natural order of liquidation and rebirth. |
Disposable Personal Income Baseline, January 1985 - January 2017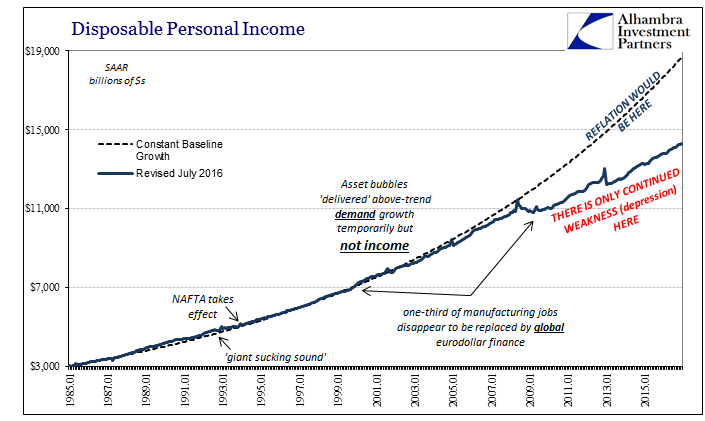 - Click to enlarge |
| After 2001, however, the relationship already strained by debt and corporatization simply broke down. The economy appeared to be growing but it was only doing so as a function of debt supplementation as a further function of eurodollar infusions (a parallel process was taking place overseas in largely EM countries, especially China, that required financing, in dollars, to take those manufacturing jobs). The credit-based monetary system became the marginal economic force. |
Household Sector Credit as GDP TIC, 1996 - 2016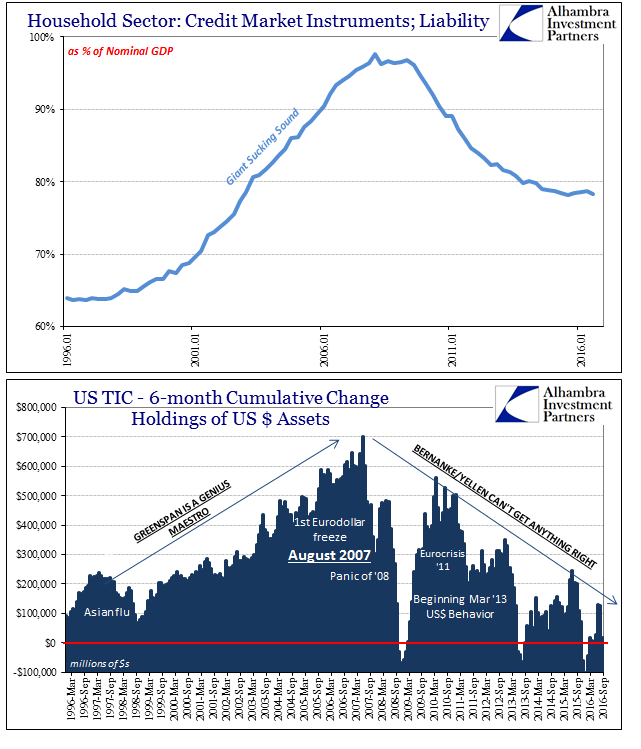 . |
| The difference before the crisis and afterward is thus perfectly straight forward; less debt, less economy. But it’s not a balance sheet recession, because the lack of debt (and the blurred distinctions of eurodollar money) has created these structural distortions. In this situation, corporate businesses have been even more reluctant to loosen up their cost structures and allow necessary labor gains as well as raises in wage rates and total compensation. This risk environment also manifests in an even larger imbalance in favor of financial redistribution of corporate income (share repurchases and dividends) instead of productive capex investment (corporate liquidity preferences where favorable perceptions of QE were actually counterproductive). |
Payrolls Participation Problem CNCF, 1985 - 2015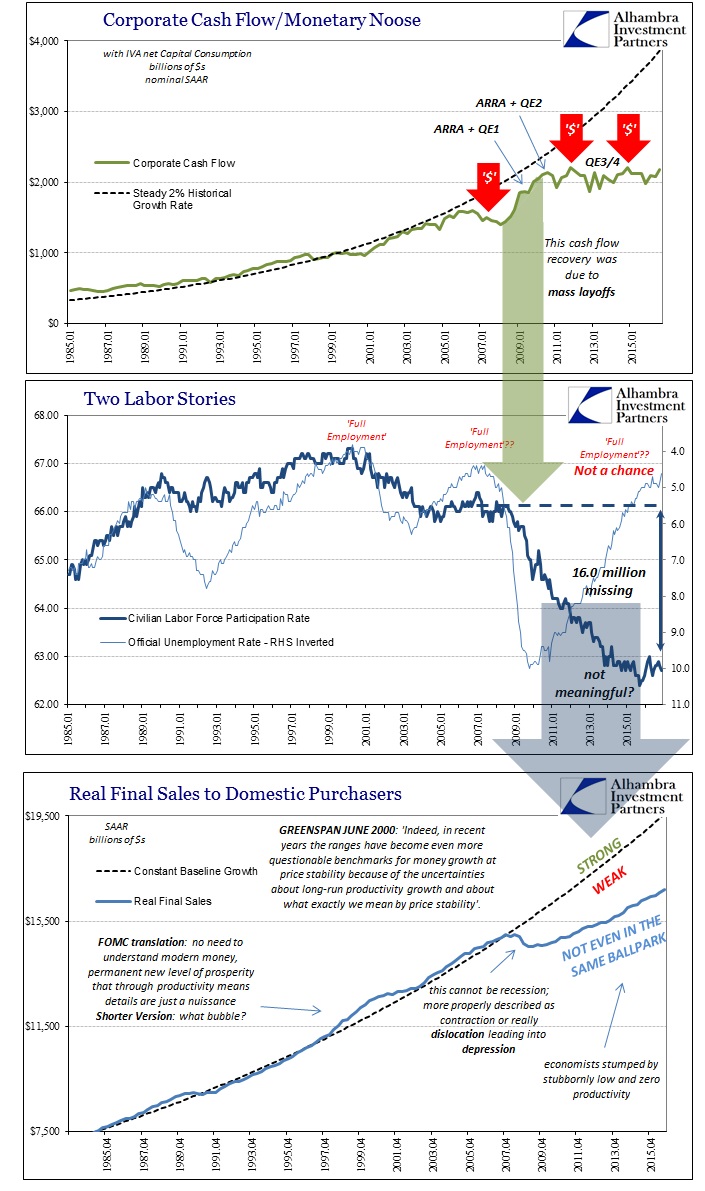 - Click to enlarge |
| With fewer people working proportional to the population for all these reasons, there never was a great buildup of marginally expendable workers during the aftermath. Fewer superfluous workers overall, indeed fewer workers, means that there will be very little trimming of payrolls even during periods of considerable and serious weakness. Instead, that weakness might appear more like a hiring freeze than mass layoffs. This is a condition that actually appeared in Japan starting in the late 1990’s, and hasn’t really left, where unemployment always stays low but the pace of additional hiring never truly accelerates. |
Average Weekly Earnings Production and Nonsupervisory, January 1990 - January 2016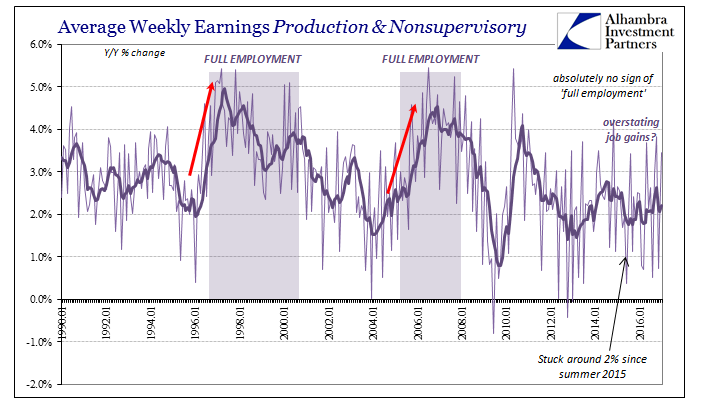 - Click to enlarge |
| This doesn’t mean that companies won’t appeal to mass layoffs at some point in the future, however it suggests that the trigger point for them to do so is perhaps much higher in terms of economic weakness. In 2012, as 2015-16, there were only small and temporary breaks in the trend for initial jobless claims despite the economy at each of those times being consistent with significant slowdown or ever near-recession.
If corporate businesses just don’t hire much on the way up, largely because there has been no up, then they surely aren’t going to fire many when times are merely rougher because it never stopped being rough and they really can’t cut back any further at the margins. We don’t get another recession unless it’s a really big one, like 2008, and we remain stuck without growth (through the labor channel, which is where it really should come from) into the foreseeable future. Though there are a few assumptions included to make this analysis work, it is a reasonable possibility reinforcing the non-trivial and dangerous potential for (further) Japanification. |
Average Weekly Hours All Employees, August 2007 - August 2016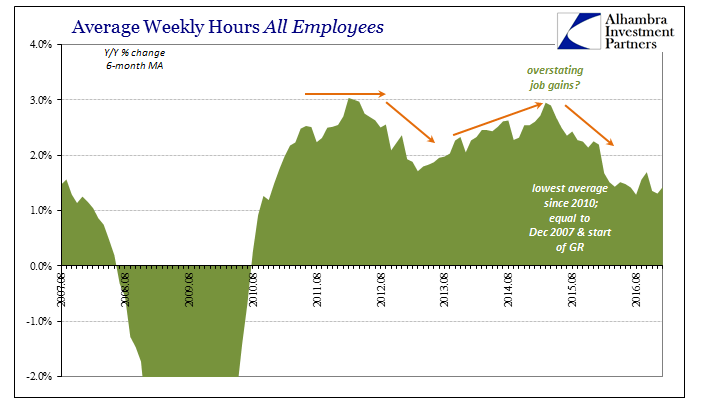 - Click to enlarge |
Tags: credit,currencies,debt,dollar,economy,EuroDollar,eurodollar standard,Federal Reserve/Monetary Policy,GDP,household debt,income,Initial Jobless Claims,Japan,jobless claims,Markets,newslettersent,QE,unemployment insurance,unemployment rate,wages