Real interest rates are nominal rates adjusted for inflation expectations. Inflation expectations are tricky to measure. The Federal Reserve identifies two broad metrics. There are surveys, like the University of Michigan’s consumer confidence survey, and the Fed conducts a regular survey of professional forecasters. There are also market-based measures, like the breakevens, which compare the conventional yield to the inflation-linked, or protected security (TIPS).
When an investor buys a bond, they are securing a nominal yield. Nominal interest rate differentials also drive the cost of hedging, and we argue often are a key driver of foreign exchange prices.
However, some economists emphasize real yields instead of nominal yields. We have several theoretical and practical problems with such an approach. First, real yields are difficult to measure. There are not surveys, or inflation-protected securities for all countries. Second, what do real rates mean for a foreign investor? They earn nominal rates. Real rates are important for policymakers to assess if rates are stimulative or not. Real rates of return are an important metric of wealth accumulation. Real rates may also shape the hurdle rate on new investments.
Third, if survey expectations are used to discount nominal rates to derive the real rate, the surveys are conducted monthly or quarterly, and the results are not as volatile as the foreign exchange market. Fourth, the inflation-linked securities do not have the liquidity of the conventional note and bonds. This often results in the inflation-linked instruments are more volatile than conventional instruments.
This means that in a falling rate environment, the inflation-protected security yield falls faster or more than the conventional security. In a rising rate environment, the yield of the inflation-protected security typically rises faster. This means that in a period of rising interest rates inflation expectations often rise and in a period of falling rates, inflation expectations ease. This is to say that the liquidity issue tends to be sensitive to the underlying direction of interest rates.
| Often when the data is displayed, dollar and the calculation of a real rate is used on the single chart but with two scales. On top of this curve fitting exercise, correlations are eyeballed. This is not a particularly robust methodology, but it often passes muster on Wall Street.
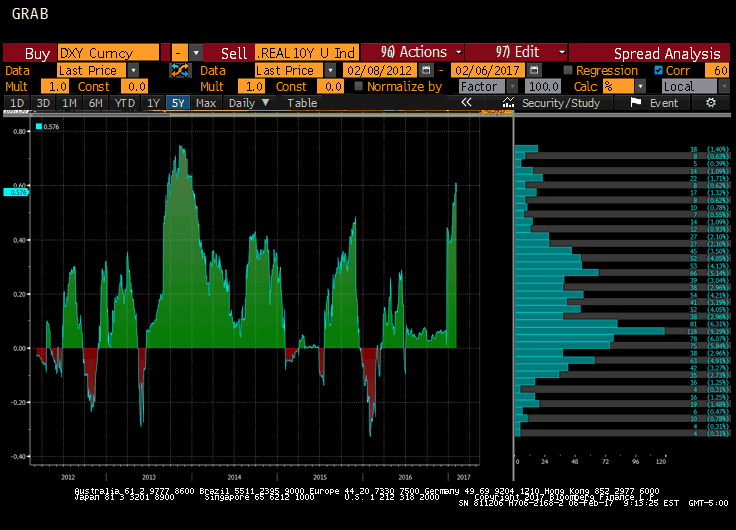
Trying to tease out a more rigorous relationship, we used Bloomberg’s analytics to create an index “Real” that is the conventional 10-year yield minus the 10-year TIP. We then ran a correlation against the Dollar Index. The Great Graphic here depicts the last five-year of the correlation conducted on the percent change of the real rate index we created and the Dollar Index. As the chart shows, the correlation is almost 0.58, which is the highest since a few months at the end of 2013. The dramatic rise in the correlation began in late-December. Nominal 10-year yields peaked the day after the Fed hiked in the middle of December near 2.64%. On December 22, when the recent low was recorded, the US reported November’s core PCE deflator which the Fed targets. It slipped to 1.6% from an upwardly revised 1.8% in October. The correlation was stable around 0.40 through the middle of January and then rose to 0.60 in early-February and has softened a little today. While the results are interesting, to improve the rigor of the exercise, we need to look at the correlation between the Dollar Index and the nominal yield. Over the past 60 days, the correlation conducted on the percent change of the nominal 10-year yield and the Dollar Index is slightly higher than the correlation with real (conventional minus TIPS) yield. It stands a little above 0.59 now. It is also more stable than the correlation with real rates. The Dollar Index correlation with the 10-year nominal yield has been holding above 50 since last October. |
US Dollar Index Currency 2011-2017 |
The results over the past 30-day suggest that this pattern has not weakened. Using our calculation of the real rate, the correlation with the Dollar Index is about 0.61, and with the nominal 10-year yield the correlation is a little more than 0.64. Again the correlation with nominal yields appears more stable, as well.
What does this all mean? Our work suggests that the nominal yield presently has a stronger correlation to the Dollar Index than the real yield and is more stable. Given the liquidity issue we raise, it suggests that this calculation of real interest rates is heavily influenced by the direction of interest rates.
There are many different ways to parse the data and explore the issue. We did not deflate the nominal yield by the core PCE deflator or core CPI. We think that would be a misuse of the core measures and we are interested in inflation expectations not current inflation for the purposes of discovering the real rate. A takeaway for investors is that the nominal rate is simpler to calculate and monitor and its relationship to exchange rates seem more stable than using real rates. When queried, asset managers tend to focus on nominal rather than real rates. The relatively firm correlation between US nominal rates and the Dollar Index suggests our basic framework remains intact.
Lastly, we note that the Dollar Index has a modest weight for the Japanese yen (13.6%). However, when we ran the correlations, the results were broadly similar. The dollar-yen exchange rate was more correlated over the past 60 days with the nominal 10-year US yield (0.75) than our calculation of the real yield (0.64).
Full story here Are you the author? Previous post See more for Next post
Tags: #USD,$JPY,Great Graphic,Interest rates,newslettersent,real rates


