George Dorgan
My articles My siteAbout meMy videosMy books
Follow on:LinkedINTwitterSeeking Alpha
CFA SocietyEconomicBlogs
We do not like Purchasing Power or Real Effective Exchange Rate (REER) as measurement for currencies. For us, the trade balance decides if a currency is overvalued. Only the trade balance can express productivity increases, while REER assumes constant productivity in comparison to trade partners.
On the other side, a rising trade surplus may also be caused by a higher savings rate while the trade partners decided to spend more. Recently Europeans started to increase their savings rate, while Americans reduced it. This has led to a rising trade and current surplus for the Europeans.
To control the trade balance against this “savings effect”, economists may look at imports. When imports are rising at the same pace as GDP or consumption, then there is no such “savings effect”.
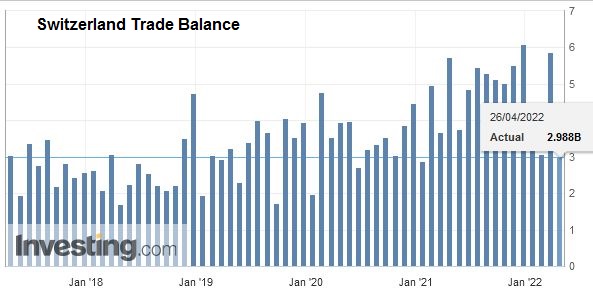
Following a decline the previous year, foreign trade grew again in 2016, with chemicals and pharmaceuticals shaping the trend. Exports climbed by a total of 3.8% (real: – 0.8%) to a record high of CHF 210.7 billion. However, the two other large groups – machinery and electronics, and watches – were unable to participate in the growth. Imports increased by 4.1% (real: +1.2%) to CHF 173.2 billion. The trade surplus reached a new peak of CHF 37.5 billion.
|
December 2016: foreign trade ends the year on a positive note
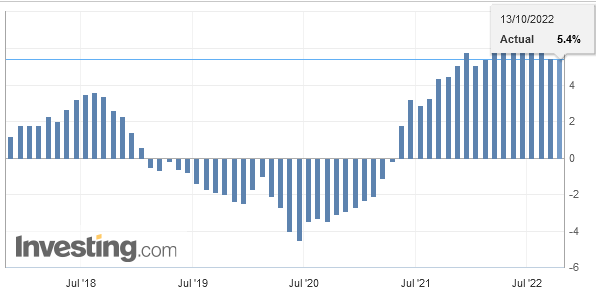
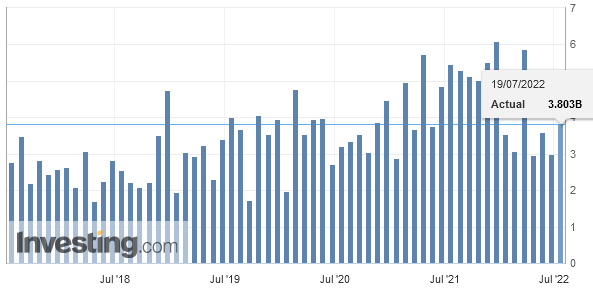
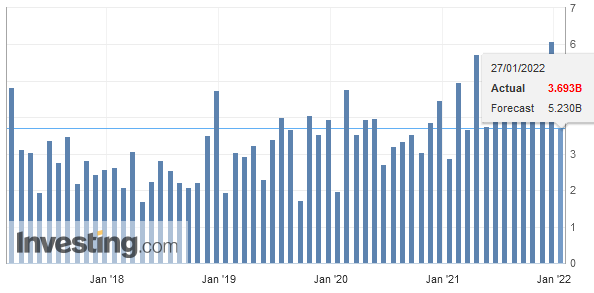
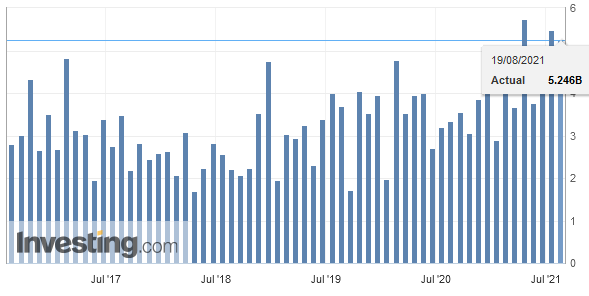
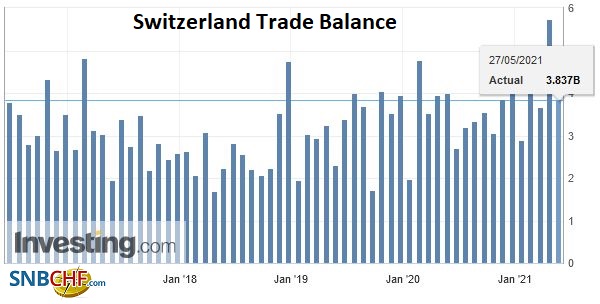
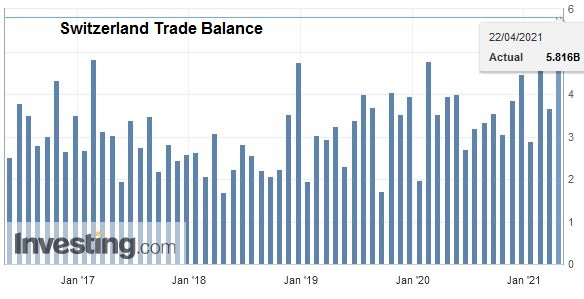
In the last month of 2016, foreign trade in both directions increased significantly: corrected for the number of working days, exports were up by 7.0% (real: +6.1%) and imports by 5.9% (real: +1.5%). In the case of imports, prices rose considerably. In terms of exports, machinery and electronics increased by 14%; however, there had still been a substantial decline in the corresponding prior – year period. The trade surplus amounted to CHF 2.7 billion.
|
Switzerland Trade Balance, December 2016(see more posts on Switzerland Trade Balance, )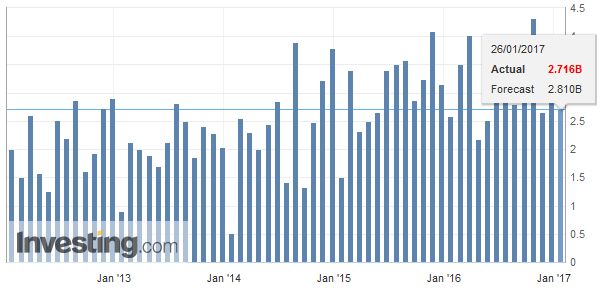 Source: Investing.com - Click to enlarge |
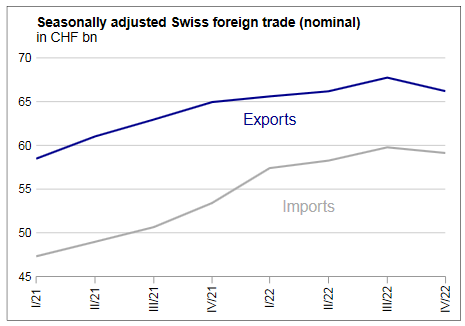
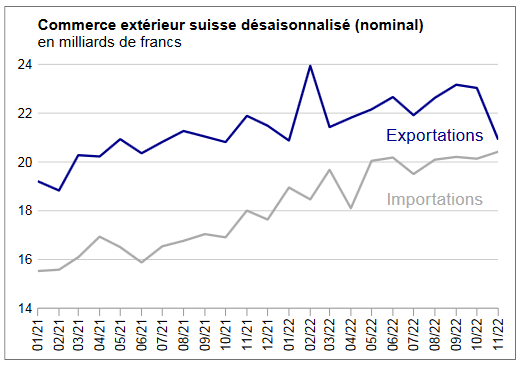
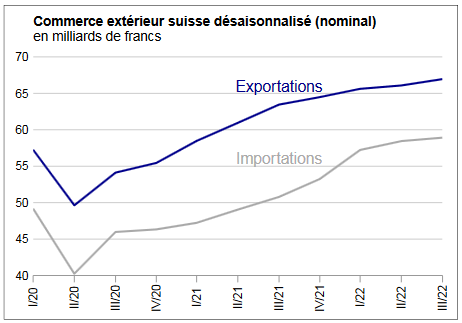
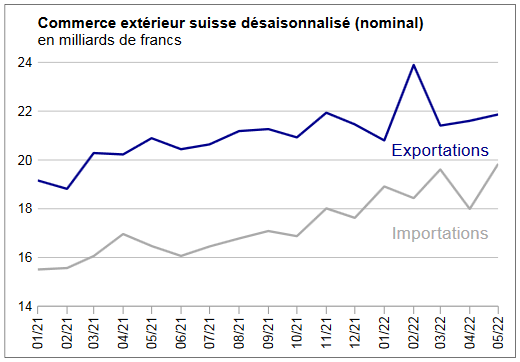
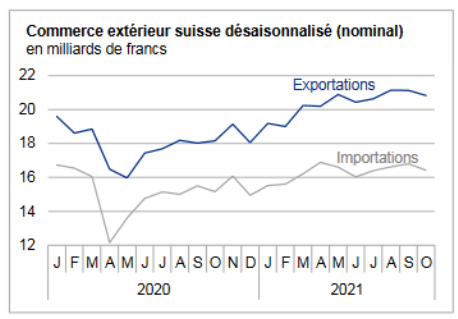
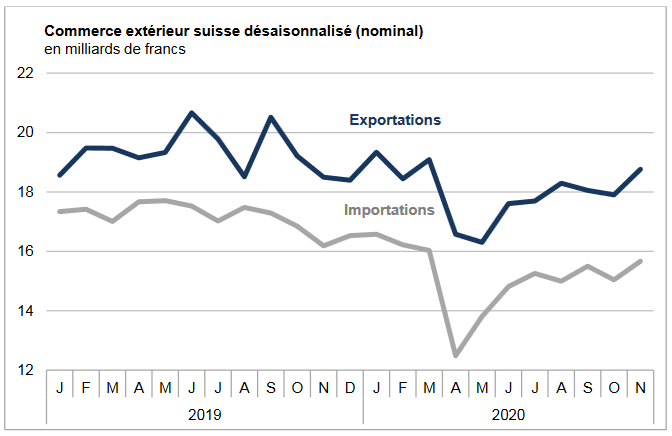
Exports and Imports YoY DevelopmentExports rose by 3.8% (real: – 0.8%) to CHF 210.7 billion in 2016 to reach a new all – time high. However, the result was largely influenced by pharmaceuticals and their price trend. Exports strengthened from quarter to quarter, but then dropped in the fourth quarter of 2016.
Imports rose by 4.1% (real: +1.2%) to CHF 173.2 billion, but they nevertheless remained CHF 13.7 billion below the record high of 2008. Imports lost significant momentum from the second half of 2016 onwards.
▲ Foreign trade with the EU in positive territory
▲ Exports: record levels with the United States, China and Japan
▼ Watch sales: in negative territory for the second consecutive year
▼ Stagnant exports of machinery and electronics
|
Swiss exports and imports, seasonally adjusted (in bn CHF)(see more posts on Switzerland Exports, Switzerland Imports, )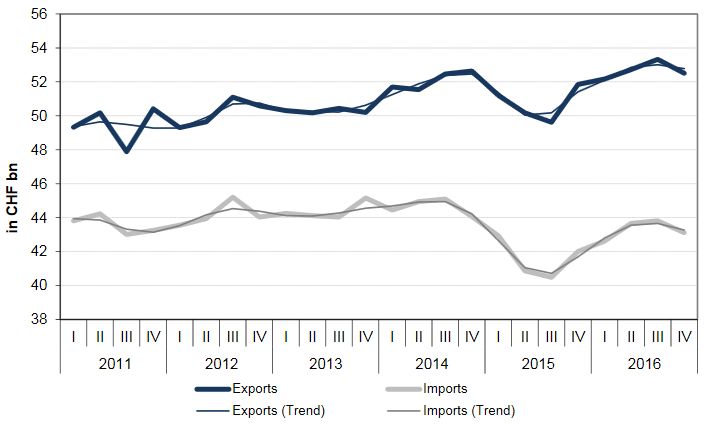 Source: Swiss Customs - Click to enlarge |
Sector findingsSeven product groups posted an export increase in 2016.
However, chemicals and pharmaceuticals significantly outstripped the other groups with growth of +11%, or CHF 9.7 billion, and thereby achieved a new record level of sales. Meanwhile, deliveries of machinery and electronics, the second – largest group, stagnated; that group’s sales have not grown since 2011. Exports of watches fell by a tenth, or CHF 2.1 billion.
In the case of chemicals and pharmaceuticals , shipments of medicinal products rose by 19% (up CHF 6.1 bn) and those of pharmaceutical active principles were up by 15%, or CHF 1.8 billion. Exports of immunological products likewise grew by CHF 1.9 billion, or 8%. The increase in the textiles, clothing and shoes segment stemmed exclusively from returns. Exports of precision instruments, food, beverages and tobacco, and metals increased by be tween 2% and 4%. Although machinery and electronics declined overall, exports of non – electrical engines rose by 9% and those for the paper and graphic industry were up by 6%.
|
Swiss Exports by Industry Sector, YoY 2016(see more posts on Switzerland Exports, Switzerland Exports by Sector, )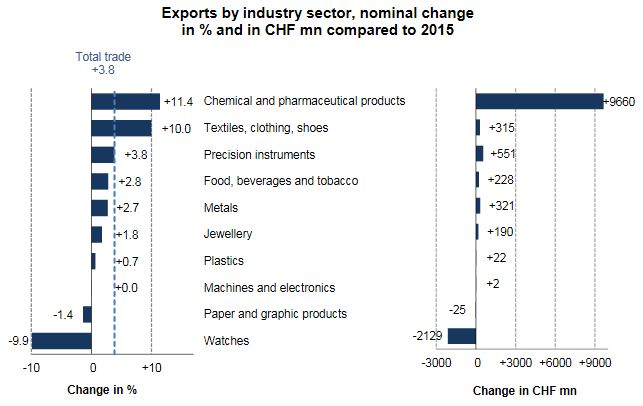 Source: Swiss Customs - Click to enlarge |
|
Import growth attributable to chemicals and pharmaceuticals, and commercial aircraft
There was a significant spread in imports, going from +13% (vehicles and chemicals and pharmaceuticals) to -21% (energy sources). Although the increase of CHF 6.8 billion was broadly based, chemicals and pharmaceuticals alone accounted for 70%. The decline in energy source sales was largely price driven (real: -2%).
|
Swiss Imports by Industry Sector YoY 2016(see more posts on Switzerland Imports, Switzerland Imports by Sector, )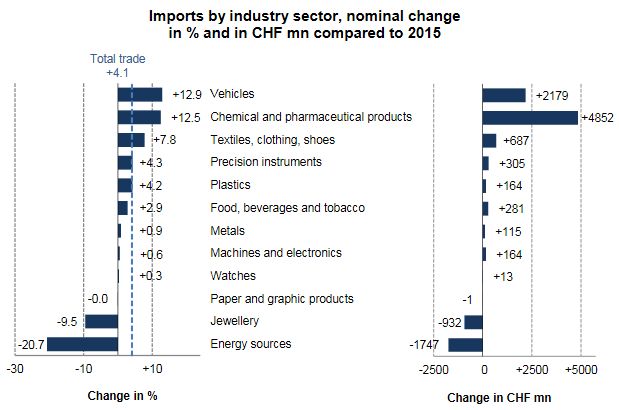 Source: Swiss Custom - Click to enlarge |
Country FindingsGeographically, the additional sales were concentrated in North America (+13%; USA at new high; up CHF 4 bn) and Europe (+3%; EU: +4%), with Germany (up CHF 3 bn) and Belgium (up CHF 602 mn) in particular posting a striking performance. In contrast, deliveries to the United Kingdom were down, as were those to Italy, which reached its lowest level since 2003. Exports to Asia stagnated overall. Additional deliveries to Japan (up CHF 928 mn) and China (up CHF 889 mn) – both at all – time highs – stood against lower exports to Hong Kong (down CHF 892 mn; watches) and Saudi Arabia (down CHF 496 mn; aircraft). Exports to Latin America declined by a total of 5%.
|
Swiss Exports per Country YoY 2016(see more posts on Switzerland Exports, Switzerland Exports by Country, ) Source: Swiss Customs - Click to enlarge |
|
In 2016, purchases from the three strongest trading continents increased, particularly those from North America and the United States (+22%, or +2.6 bn). Here, primarily commercial aircraft played a role, as did pharma products. Imports from Europe and the EU rose by 3%, with the noteworthy performers being Germany (up CHF 1.6 bn) – its first increase in five years – Ireland (up CHF 631 mn; pharma), Spain and Italy. In Asia (+3%), imports from Vietnam (up CHF 503 mn; primarily consumer items made from precious metals) and South Korea surged, whereas purchases from Hong Kong, Japan and China declined by a total of CHF 394 million. Incidentally, it was China’s first decline since 2002. Imports from Latin America declined by 22%; there was a drop of a third in goods from Mexico.
|
Swiss Imports per Country YoY 2016(see more posts on Switzerland Imports, )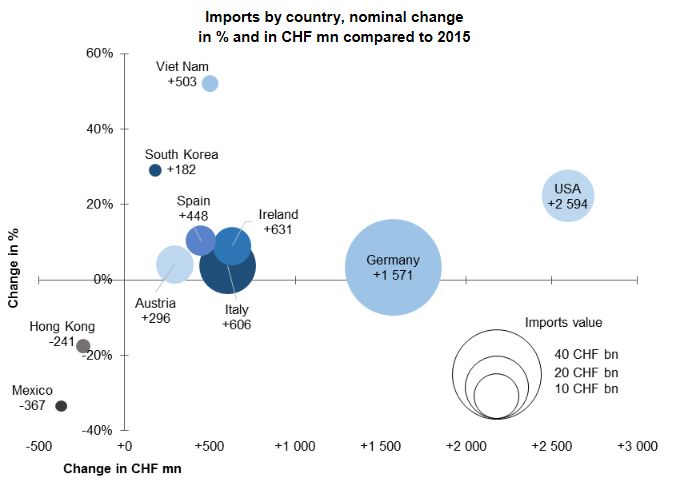 Source: Swiss Customs - Click to enlarge |
Are you the author?
George Dorgan (penname) predicted the end of the EUR/CHF peg at the CFA Society and at many occasions on SeekingAlpha.com and on this blog. Several Swiss and international financial advisors support the site. These firms aim to deliver independent advice from the often misleading mainstream of banks and asset managers.
George is FinTech entrepreneur, financial author and alternative economist. He speak seven languages fluently.
Tags: newslettersent,Switzerland Exports,Switzerland Exports by Country,Switzerland Exports by Sector,Switzerland Imports,Switzerland Imports by Sector,Switzerland Trade Balance