Summary:
Net exports was a large drag on growth.
Inventories flattered growth.
Underlying signal, final domestic demand, increased 2.5% after 2.1% in Q3.
| The first estimate of Q4 16 US GDP undershot expectations at 1.9%.Most had looked for annualized pace of a little more than 2% after the 3.5% pace in Q3. The Q3 pace was always suspect given the unsustainable surge in agriculture (soy) exports. Net exports were a significant drag on GDP, taking 1.7 percentage points off growth. That is the most since Q2 2010. |
U.S. Gross Domestic Product (GDP) QoQ, Q4 2016(see more posts on U.S. Gross Domestic Product QoQ, )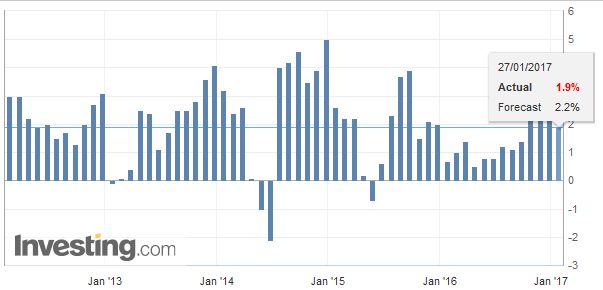 Source: Investing.com - Click to enlarge |
| Personal consumption slowed from 3.0% in Q3 to 2.5% in Q4. However, domestic demand was complimented by an increase in business investment on equipment (3.1%) for the first time in over a year (five quarters). Inventories that had been liquidated earlier in the year (and were a drag on growth) contributed the most since early 2015. In Q4, inventories rose at an annualized pace of $48.7 bln compared with $7.1 bln in Q3. Inventories added 1.0% to growth. |
U.S. Real Consumer Spending, Q4 2016(see more posts on U.S. Consumer Spending, )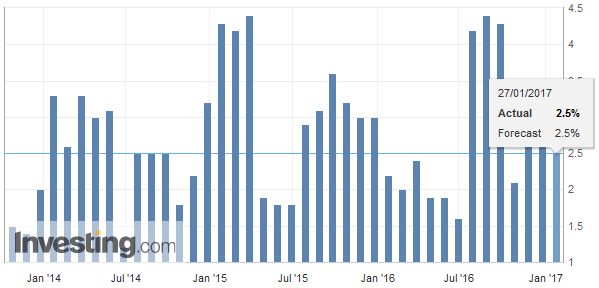 Source: Investing.com - Click to enlarge |
|
The key measure of the Federal Reserve is final domestic sales. This measure excludes inventories and trade. It is the cleanest signal of the underlying strength of the US economy. It expanded by 2.5% in Q4 after a 2.1% pace in Q3. |
U.S. Gross Domestic Product (GDP) Price Index QoQ, Q4 2016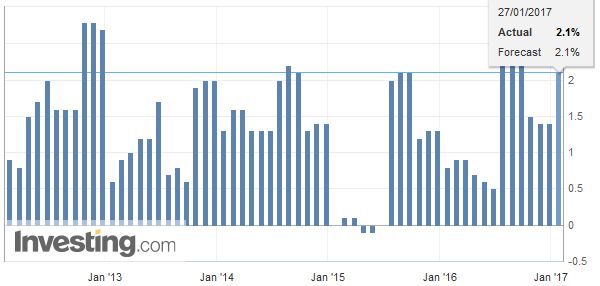 Source: Investing.com - Click to enlarge |
| The US 10–year yield eased on the news and is below 2.50%. The dollar has been sold, and the euro is trying to extend its advance for the sixth consecutive week. The US dollar has also be pushed below JPY115. The dollar has not closed above its 20-day moving average against the yen (~JPY115.10) since January 4. |
Yield US Treasuries 10 years, January 28(see more posts on U.S. Treasuries, )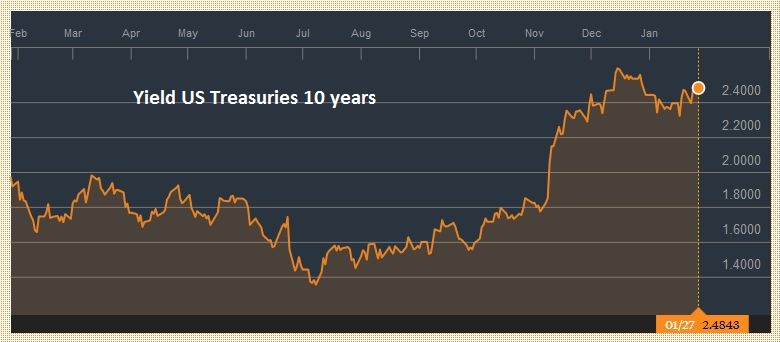 Source: bloomberg.com - Click to enlarge |
Government spending rose at a 1.2% annualized rate. However, the government that was spending was not the federal government. Spending at the federal level contracted (-1.2%), as it has in two of the first three-quarters of the year. The increase in government spending is solely a function of state and local government. Earlier this week, we noted that while the new US government froze hiring by the federal government, the growth in government employment was also largely a state and local government phenomenon.
The implication of the softer than expected GDP report is minimal. First, it is subject to statistically significant revisions. Second, it is dated, and the Federal Reserve sets policy on a forward-looking basis. Third, the final domestic demand component will confirm the underlying strength of the US economy. The FOMC meets next week, and no one is expecting a change in policy so soon after the December hike. Surely, one cannot expect how the economy did in October through December to have much impact on the Fed’s decision in March. The March Fed funds futures contract finished last week implying 69 bp. Now it is at 70 bp. Bloomberg calculations suggest a little more than a one-in-three chance of a hike in March. The CME calculation puts the odds at a little less than one-in-four.
Full story here Are you the author? Previous post See more for Next post
Tags: $EUR,$JPY,Growth,newslettersent,U.S. Consumer Spending,U.S. Gross Domestic Product QoQ


