Which blocs/nations are most likely to face banking/liquidity crises in the next year?
| Hating the U.S. dollar offers the same rewards as hating a dominant sports team: it feels righteous to root for the underdogs, but it’s generally unwise to let that enthusiasm become the basis of one’s bets.
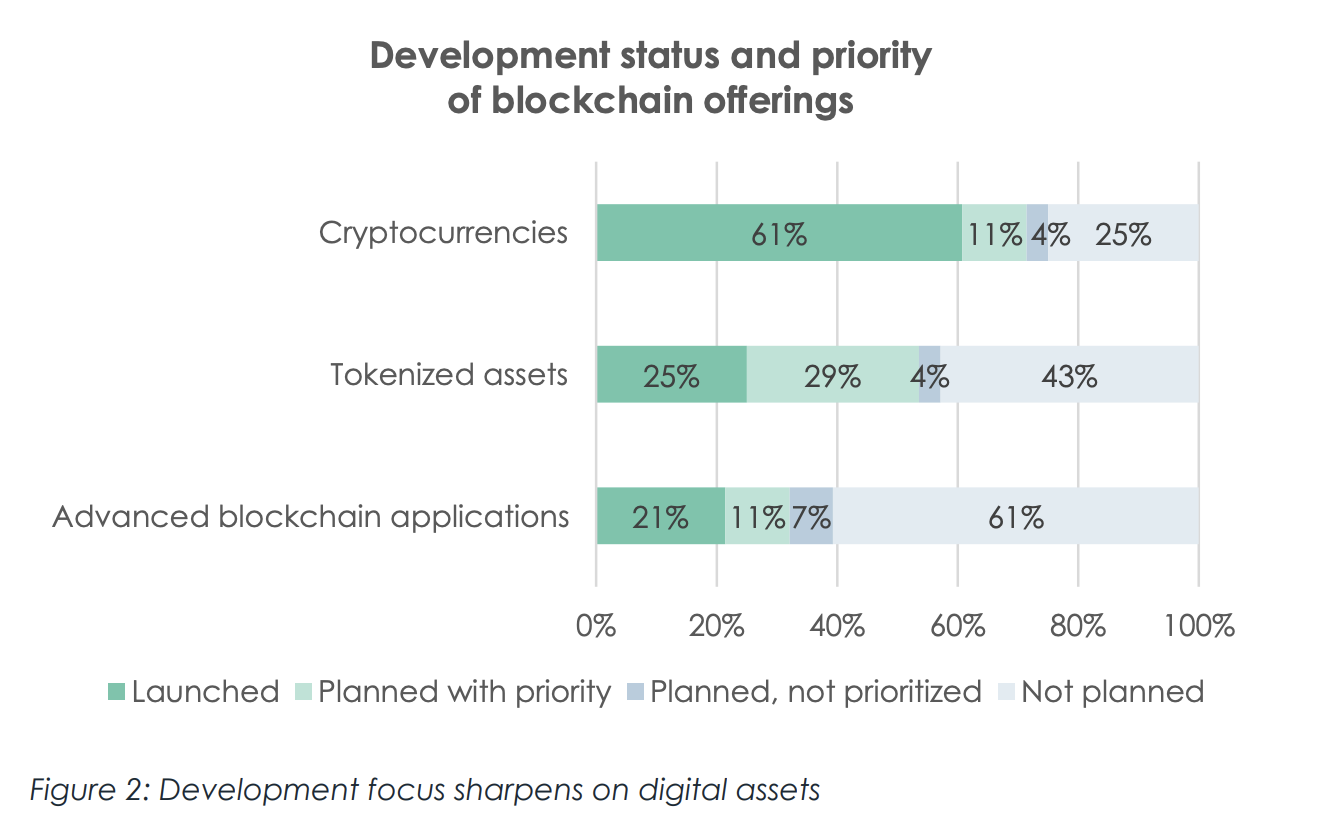
Personally, I favor the emergence of non-state reserve currencies, for example, blockchain crypto-currencies or precious-metal-backed private currencies–currencies which can’t be devalued by self-serving central banks or the private elites that control them. But if we set aside our personal preferences and look at fundamentals and charts, odds seem to favor the U.S. dollar (USD) making a major move higher in the next few months. Let’s start with a national index of finance-power which combines GDP, military spending, banking, foreign direct investment (FDI) and foreign exchange: The key take-away is the preponderance of the U.S. and the Anglo-American alliance, a.k.a. the special relationship of Great Britain and the U.S. The U.S. exceeds Germany, China, Japan and France combined, and the U.S.-Great Britain alliance is roughly equal to the next 10 nations: the four listed above plus The Netherlands, Switzerland, Italy, Spain, Canada and the Russian Federation. We don’t have to like it, but as investors it’s highly risky to act like it isn’t reality. There are other fundamentals at work as well. 1. China Bulls anticipate the RMB/yuan becoming a global reserve currency. Don’t hold your breath. As I have explained here many times, the nation issuing a reserve currency must meet two standards:
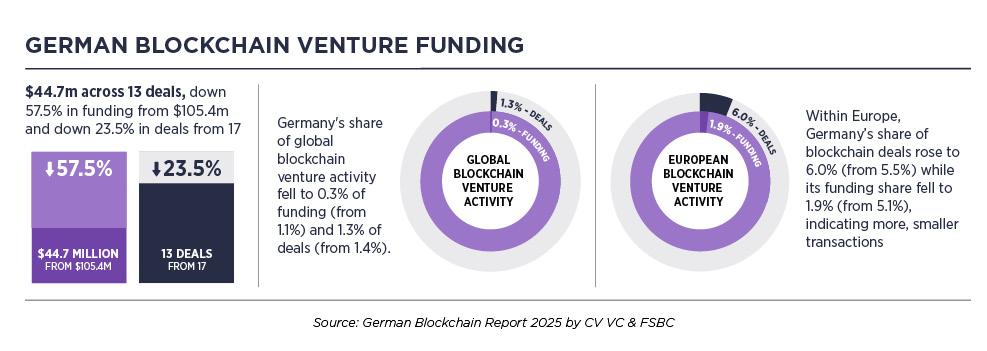
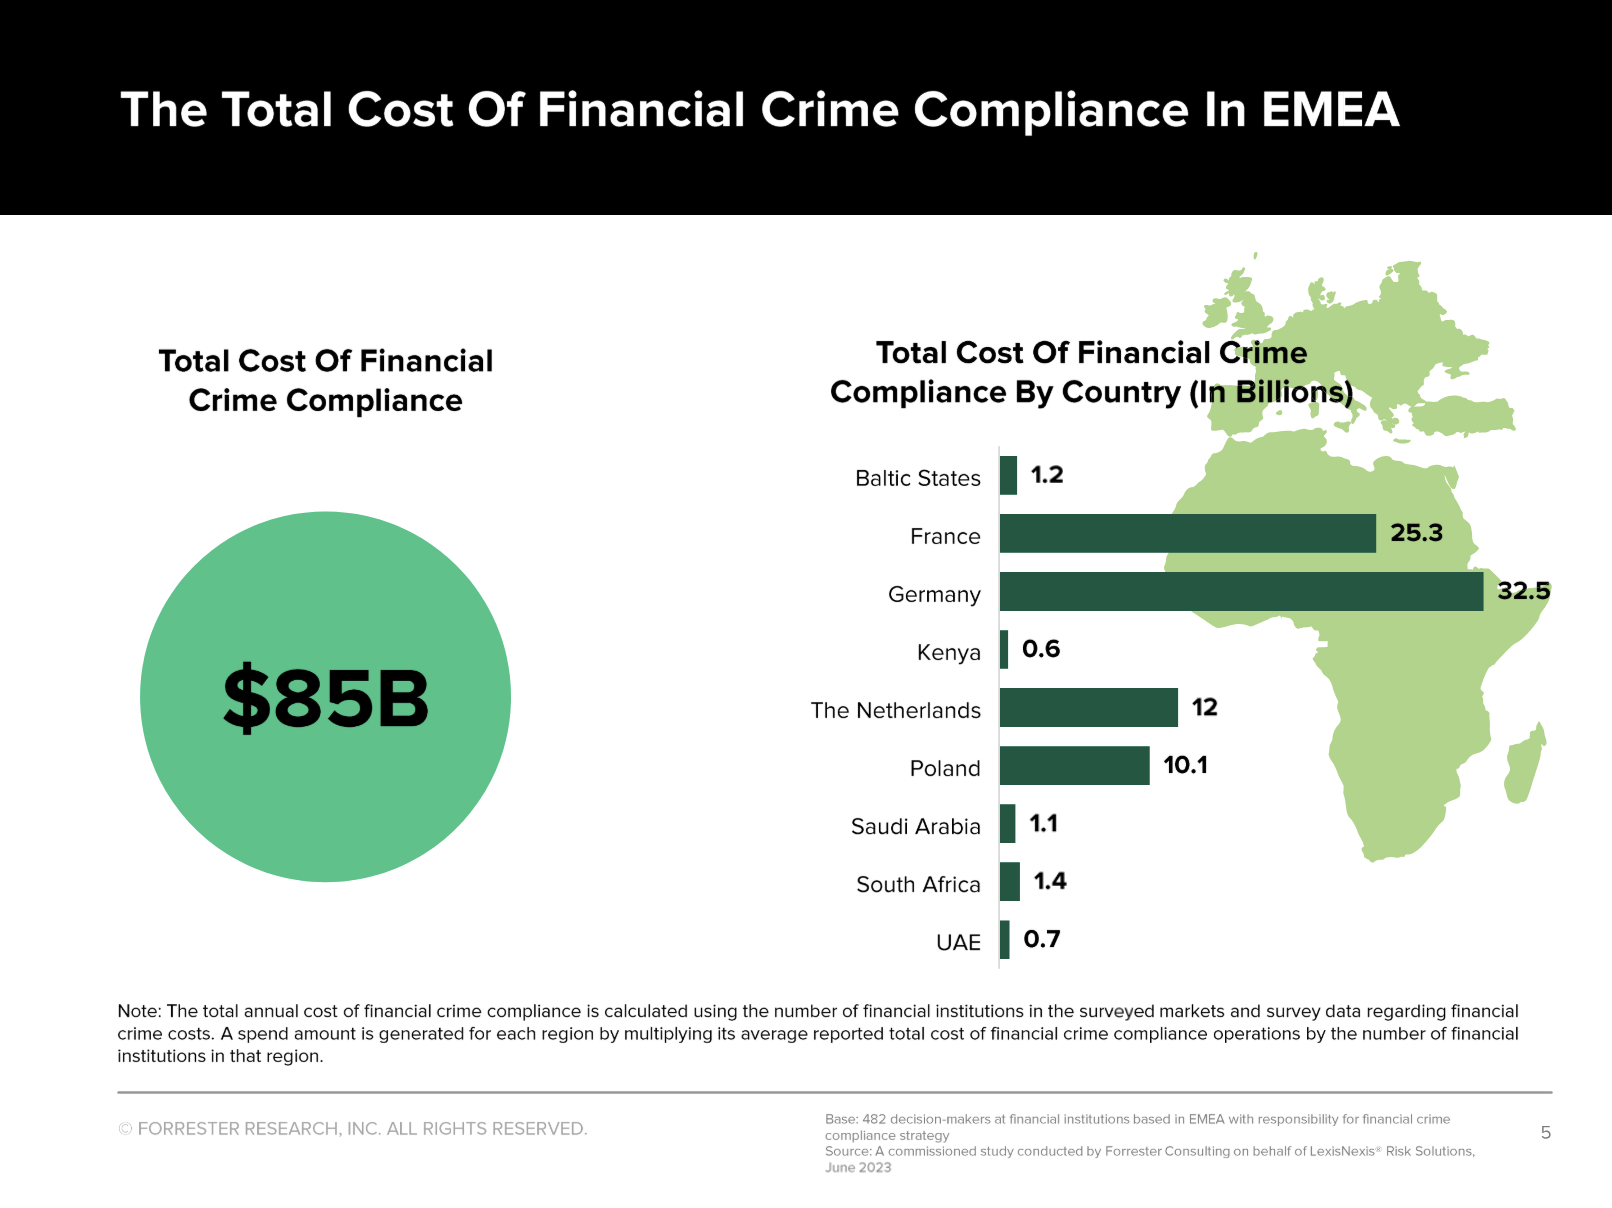
2. Which blocs/nations are most likely to face banking/liquidity crises in the next year? Hmm; the E.U., China and Japan come to mind. The U.S.–not so much. Leverage is lower, collateral is higher, and capital flows favor the U.S. Forget “Free Trade”–Focus on Capital Flows (October 28, 2014) 3. Which would you rather receive on $1 billion: -.05% interest or +.25% interest? Even if the Federal Reserve doesn’t raise rates in December, U.S. Treasury rates offer much higher yields and much lower risks of currency devaluations than competing sovereign bonds. |
|
| If you want to “follow the money,” follow capital flows. Capital is gushing out of China like flood waters through a broken dike into North America. (Canada and the U.S. also have a special relationship, as do Canada-U.S.-Mexico).
Now let’s look at a weekly and daily chart of the USD. After a couple years of consolidation/forming a base, the USD shot almost 20% higher in late 2014. Now that the USD has spent almost 2 years in another period of consolidation, the Bollinger Bands are tightening and MACD has worked its way back to the neutral line. This looks a lot like the conditions that preceded the USD’s previous 20% gain. |
|
| The daily chart is tracing out a classic wedge that typically breaks big up or down. The MACD is hovering near the neutral line; good things happen when MACD moves above the neutral line.
Wedges tend to break in continuation moves: if the trend is higher, they break higher. If the trend is lower, they break lower. The USD has been trending higher since 2014, and there is little to suggest the long-term trend has reversed. |
|
| The FX roulette wheel is still spinning, but the ball will drop fairly soon, if not in Q4 2016 then in Q1 2017. |
The Federal Reserve, Interest Rates and Triffin’s Paradox (November 19, 2015)
Full story here Are you the author? Previous post See more for Next post
Tags: Bollinger Bands,central-banks,China,ETC,Federal Reserve,France,Germany,Global Economy,Japan,MACDs Moving Average,Netherlands,newslettersent,Reality,reserve currency,Switzerland,trade deficit,yuan


