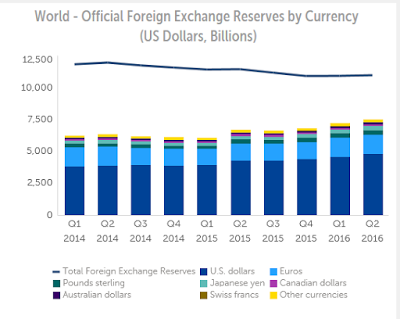
| The IMF provides the most authoritative data on central bank reserves. The composition is published at the end of the quarter for the preceding quarter. At the end of last week, its COFER report was published with data through the end of June 2016. This Great Graphic from the IMF provides 2.5 years of the composition of allocated reserves.
Beginning at the highest level, we note that the dollar value of global reserves increased by $55 bln in Q2 to $10.993 trillion. This is an important qualification. The IMF reports its reserve figures in terms of dollar value.
There is only one currency not impacted by the changes in valuation, and that, of course, is the US dollar itself. Dollar holdings (among reserves where the allocation has been declared) increased by almost $19.5 bln to $4.759 trillion. The dollar’s share of reserves was little changed at 63.4% from Q1’s 63.5% share.
|
World Official Foreign Exchange Reserves by Currency World Official Foreign Exchange Reserves by Currency - Click to enlarge |
The dollar value of yen reserves rose by 16.3% to $340.6 bln. The share of reserves denominated in yen rose to 4.54% from 4.07%. This is the highest in more than a decade. However, the data has been inflated by a 9% appreciation of the yen. The takeaway here is that the yen’s share of reserves rose but closer to half the pace suggested when allowances are made for valuation adjustments.
Sterling fell 7.3% in the three months through the end of June. The dollar value of sterling reserve rose by almost 2.4% in Q2 16 to $352.06 bln. If it were simply a matter of shifting valuations, the dollar value of sterling reserve would have fallen by about $25 bln. The overall increase (~$7 bln) reflects an increase in the accumulation of sterling reserve assets. We suspect that some reserve managers want to adjust their holdings to maintain a predetermined allocation. The loss of sterling’s value then would encourage such managers to buy more.
The dollar value of euro reserves rose by $5.45 bln to $1.515 trillion. The euro slipped 2.4% against the dollar in Q2. This suggest that there was a small amount of net buying of euros by reserve managers. The euro’s share eased to almost 20.2% from 20.3%. The euro’s share of global reserves has been fairly stable since the beginning of last year. It has been between 19.7% and 20.6% of allocated reserves.
The Canadian dollar was flat against the US dollar in Q2 (it rose 0.6%). The shift in dollar valuation of Canadian dollar reserves is primarily a result of more Canadian dollars having been bought. The value of the reserves rose to $149 bln from $141.1 bln. It share of allocated reserves edged up from 1.96% to 1.98%.
Australian dollar reserves were worth $142.99 bln at the end of Q2, up from $138.42 bln at the end of Q1. However, whereas the Canadian dollar was flat inthe quarter, the Australian dollar lost 2.7%. This means that if it were purely a function of valuation, the Australian dollar reserves would have fallen by about $4 bln. This suggests that reserve managers added small amounts Australian and Canadian dollars to their holdings.
There is another development that is noteworthy. As part of the negotiations that led to China’s inclusion in the SDR, the PRC agreed to provide the currency allocation of part of its reserves. Over the past year or so, this has produced a sharp drop in the unallocated reserves and an increase in the allocated reserves.
At the end of Q1, the dollar value of unallocated reserves stood at $5.37 trillion or 46.9% of all reserves. In Q2 16, the dollar value of unallocated reserves fell to $3.84 trillion or 31.7%. When coupled with the fairly stable currency shares of the allocated reserves suggests China’s reserve holdings were largely in line with global averages.
With the Chinese yuan now included in the IMF’s SDR, starting with Q3 COFER data, which will not be available until the end of March 2017, the IMF will break outthe yuan’s share of global reserves. Currently, the yuan is included in the omnibus “other currencies” category. At the end of Q2, the “other currencies” account for about 3.04% of allocated reserves, down from almost 3.2% in Q1 16.
A year ago, when the IMF announced its decision to include the yuan in the SDR, it estimated that about 1% of global reserves were in the yuan. The yuan’s share of global reserves is smaller than Australian and Canadian dollars’ share.
We are not convinced that inclusion of the yuan in the SDR will necessarily increase the use of the yuan as reserve assets. The yen’s share of global reserves, for example, remains minor, even with the recent increase. At the end of 1995, the yen accounted for nearly 6.8% of global reserves. As we have seen its share as of the end of Q2 16 was 4.5%. We suspect that for the most part, reserve managers will not accept a fait accompli by the IMF and boost yuan reserves simply because the yuan is included in the SDR.
The security, liquidity,and transparency of the yuan and the central government bond market (where reserves are expected to be invested) are important considerations. At the end of September Caixin reported that China’s Ministry is considering trading government debt securities, in addition to its role as the issuer. The ostensible reason is to increase market liquidity. Turnover ratio (volume of bonds available for trading relative to the volume of the outstanding bonds, sort of like free-float) is estimated to be about 5% of the US.


