Lance Roberts
My articles My offerMy siteAbout meMy videosMy books
Follow on:TwitterSeeking AlphaFacebookAmazon
On Tuesday, I noted the end of summer and the entrance into one of the weakest months of the year statistically speaking.
|
 |
|
 |
| As Donald Trump would say: “Not so good. Not so good.”
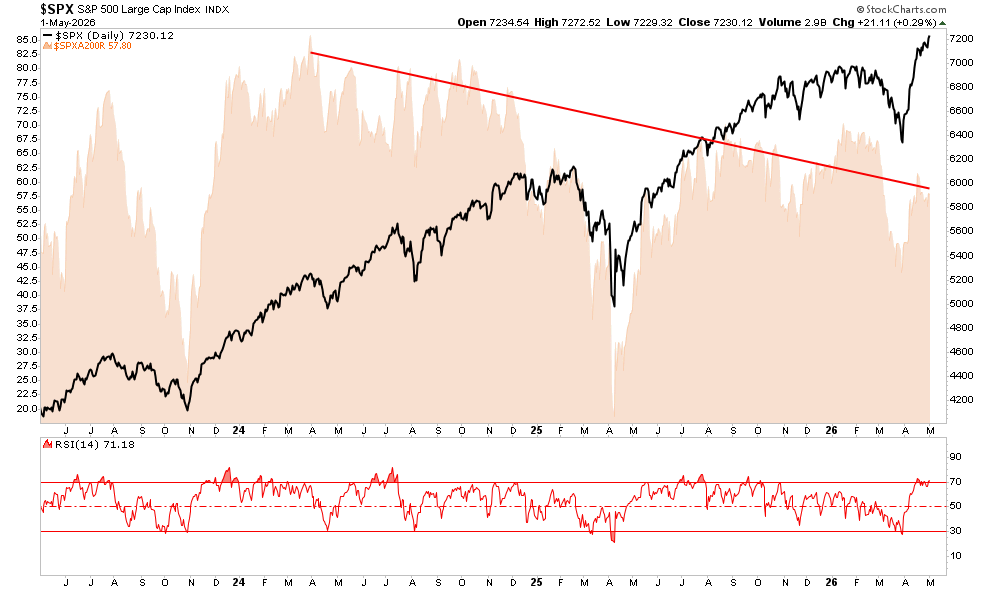
This past week has failed to break the current consolidation process that started over a month ago. As shown in the chart below, however, the “bulls” are currently facing a very important test. S&P 500 Large Cap IndexThe GREEN dots at the bottom denote when the market is oversold AND on a momentum buy signal. The combination of these factors has subsequently led to a rise in the markets. However, the RED dots denoted when the markets were on a momentum sell signal and oversold. This combination of factors has generally led to further declines. |
S&P 500 Large Cap Index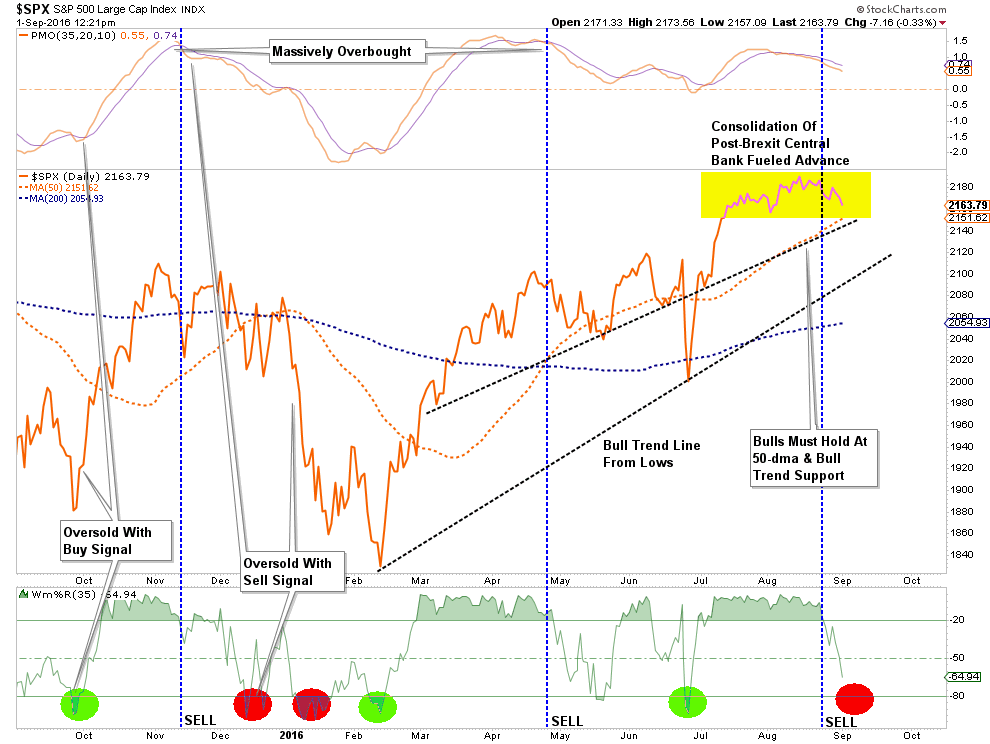 Click to enlarge. |
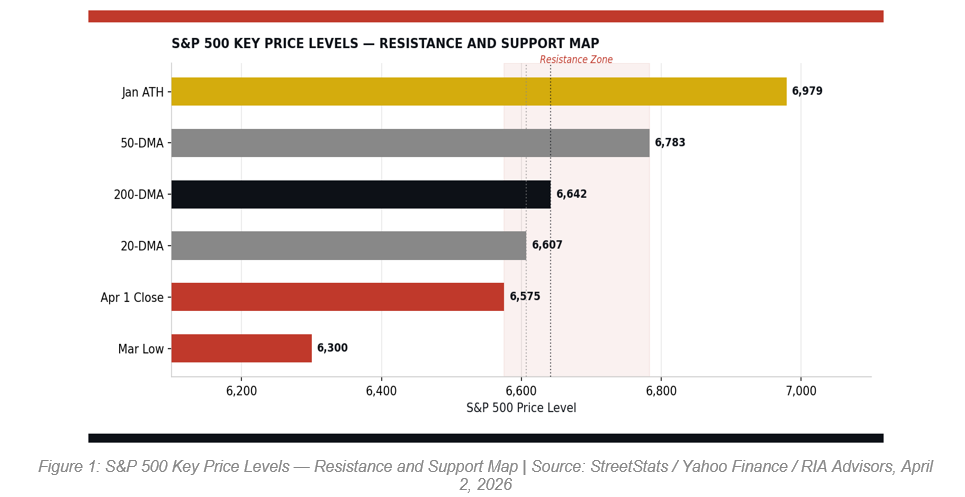
| The second situation currently exists at a time when we are entering into a seasonally weak period of the year AND ahead of a Presidential election. For the “bulls” it is critically important for the markets to find their footing at the current “bullish trend line” which is in conjunction with the 50-day moving average. A violation of that level will like witness a further decline in the month ahead. I have updated the previous target levels below.
The problem for individual investors is the “trap” currently being laid between the appearance of strong market dynamics against the backdrop of weak economic and market fundamentals. There will be a collision between the fantasy of asset prices and the reality of the underlying fundamentals. This will particularly be the case if the much-anticipated rebound of economic growth and earnings fails to materialize as has been suggested by recent economic reports. |
 Click to enlarge. |
However, as my colleague Dana Lyons penned yesterday:
With longer-term combined sell signals currently in place, and the market still processing a broadening topping pattern, the extremely high levels of “complacency” are likely misplaced. But then again…I worry a lot. Here is what I will be reading this weekend. |
 Click to enlarge. |
Fed / Economy
- US Economy: Bad Moon Rising by Danielle DiMartino-Booth via Money Strong
- Fed’s Fascination With Unreliable Data by Caroline Baum via MarketWatch
- Fed Has Mastered Market Manipulation by Jeff Cox via CNBC
- Yellen Sees Strong Case For Rate Hike by Binyamin Appelbaum via NY Times
- Crutch Holding Up Economy Is Failing by Bob Bryan via BI
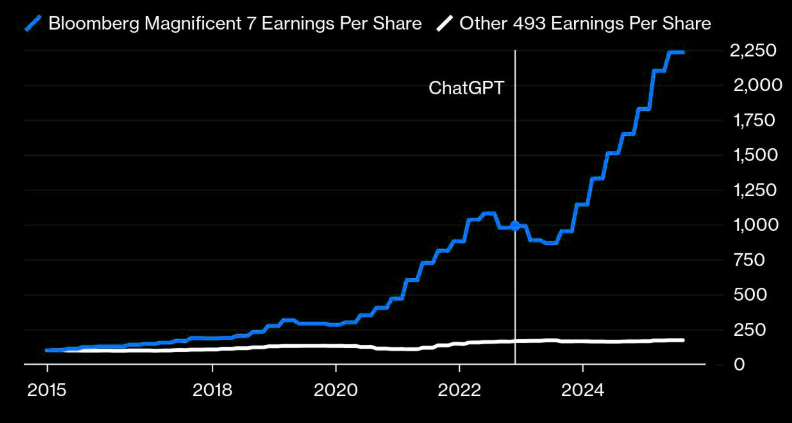
- Chart Shows Central Banks Driving Markets by Tyler Durden via Zero Hedge
- What Yellen May Have Said by Jeffrey Snider via Alhambra Partners
- El-Erian: 5 Things Post-Jackon Hole by Mohamed El-Erian via Yahoo
- Fed’s Bad Timing For Rate Hike via Investors Business Daily
- Fed Shouldn’t Expect Trust by Larry Summers via The Washington Post
- The Monster In The Mirror by Scott Sumner via EconoLib
- Fed Myths vs. Reality by Wade Slome via Investing Caffeine
- A Failure To Communicate by Alexandra Scaggs via FT
- Why The Fed Might Need To Go To (-2%) by Leslie Shaffer via CNBC
Markets
- Apocalypse Never by Eric Parnell via Seeking Alpha
- One Chart Shows Investor’s Greatest Wish by Mark Gilbert via Bloomberg View
- Jackson Hole Changed The Stock Market Game by Jim Collins via TheStreet
- What Is Dow Theory Saying Now by Chris Ciovacco via Ciovacco Capital
- Corrective Action Could Be Developing by Doug Kass via Real Clear Markets
- Long Term Sell Signal For Stocks? by Chris Ciovacco via Ciovacco Capital
- UBS: Low-Vol Risk Event Is Coming by Tyler Durden via Zero Hedge
- Crowded Trades by Ellie Ismailidou via MarketWatch
- Quiet August Could Give September Wakeup by Patti Domm via CNBC
- Investors Treading On Thin Ice by Bill Gross via Janus Capital
- 38-Days Of Silence by Matt Egan via CNN Money
- The Stocks Millennials Love To Buy via Evelyn Cheng via CNBC
- Could This Be 1987? by Chris Matthews via Fortune
- No One Knows Why September Sucks by Mark Hulbert via MarketWatch
- Update On The Stock Buyback Binge by Anthony Mirhaydari via Fiscal Times
Just Great Reads
- Is The Oil Industry Dying? by Richard Heinberg via Pacific Standard
- Ignoring Fundamentals: Speculation Driving Oil by Rakesh Upadhyay via Yahoo
- Millennials Face Wage/Debt Serfdom by Charles Hugh-Smith via OfTwoMinds
- Magical Thinking by Ben Hunt via Financial Sense
- Unraveling The Secular Stagnation Story by Steve Hanke via CATO Inst.
- Inequality Today, Catastrophe Tomorrow by Dr. Robert Shiller via NYTimes
- Why ObamaCare Failed by Shikha Dalmia via The Week
- Behind The Massive Debt Binge by Norman Mogil via Financial Sense
- 3 Charts Behind The Pension Short Fall by Anthony Mirhaydari via Fiscal Times
- “Bogle’s Folly” Turns 40 by Jason Zweig via MoneyBeat
- 10-Things A Trader Needs To Give Up by Steve Burns via See It Market
- Optimism Bias And Investor Denial by Samantha Debbie via InvestmentWatch
- The Apotheosis Of Bubble Finance by David Stockman via Contra Corner
- Reasons For & Against The Bull Market by Dana Lyons via Tumblr
- Buybacks Blew Another Financial Bubble by Jesse Felder via The Felder Report
“The interests Of The Financial Media And Wall Street Are Not Aligned With The Individual Investor.” ― Larry Swedroe
Full story here Are you the author?
Tags: Lance Roberts,newslettersent,S&P 500 Index,S&P 500 Large Cap Index