Summary:
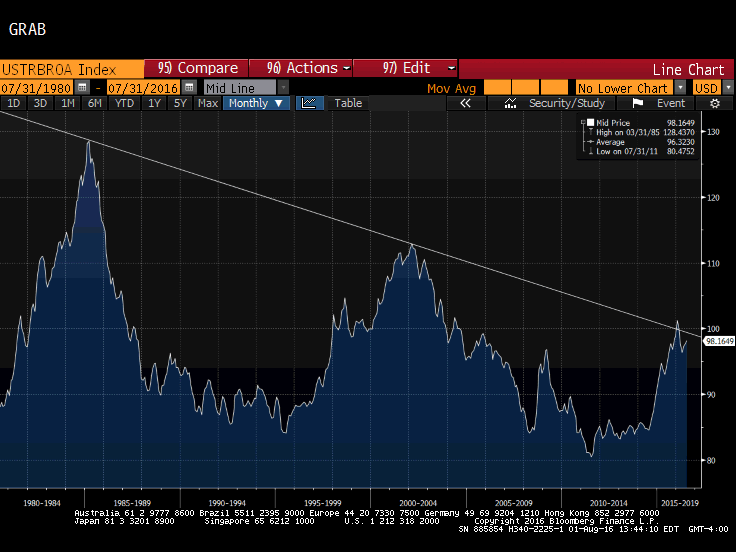
The real broad trade-weighted dollar index rose in July for the third month.
It peaked in January above trendline drawn through the Reagan and Clinton dollar rallies.
Expect the trendline to be violated again before the end of the year.
| This Great Graphic, created on Bloomberg, depicts the Federal Reserve’s real broad trade-weighted index of the dollar. Real means that it is adjusted for inflation differentials. Broad means that it covers a wide number of US partners. Trade-weighted means that the countries that the US has more trade with are given greater role in the index.July was the third consecutive month that this measure of the dollar appreciated and the fourth month of the year. Last year, the real broad trade-weighted measure of the dollar increased in nine of the 12 months. In 2014, it rose in eight months.
The multi-year highs were set in January. That is when it barely took out the trendline drawn off the peaks of the Reagan and Clinton dollar rallies. It then pulled down by around 5% in the February through April period. It rose a 1% in May and rose by less a little less than that over the next two months. The failure of the Fed to hike rates in H1, and some giving up a hike over the next 12 months, has prompted some to suggest that the dollar rally is over. We are less convinced this is the case. The US economy is not as weak as the headline of the preliminary estimate of Q2 GDP suggests, and the run down in inventories for a third consecutive quarter, may help set the stage for stronger H2 growth. We continue to think that the ECB and BOJ’s experiments with negative interest rates will not end well. Look for this trendline to be violated before the end of the year. |
Tags: #USD,Great Graphic,newslettersent


