Marc Chandler
My articles My offerMy siteAbout meMy videosMy books
Follow on:LinkedINTwitterSeeking AlphaAmazon
George Dorgan
My articles My siteAbout meMy videosMy books
Follow on:LinkedINTwitterSeeking Alpha
CFA SocietyEconomicBlogs
Summary:
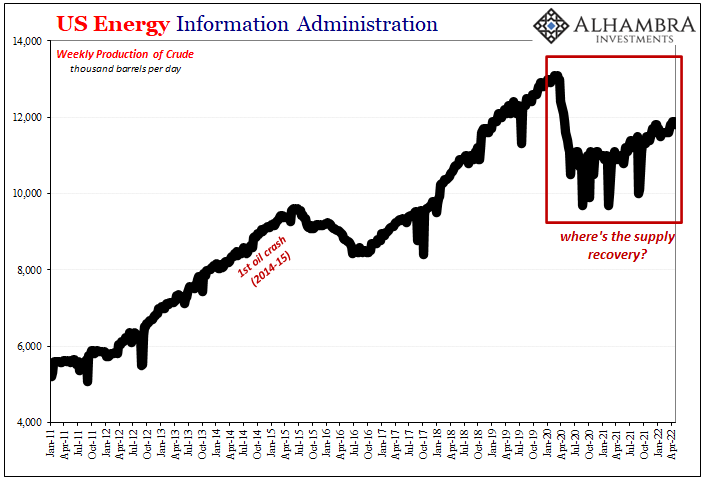
Oil is breaking down.
Doubts are growing over output freezes while US inventories rise.
The technicals are poor.
|
Oil has broken down further today. The ostensible trigger was the larger than expected build in US inventories. However, the price of oil has been trending lower since the beginning of last week. It appears that our skepticism of talk of an output freeze is gaining support. The Saudis have indicated that they do not see a need for action, while the Iranians have not yet returned output to pre-embargo levels.
This Great Graphic, created on Bloomberg, shows the recent run-up from early August and the more recent decline in the October light sweet crude oil futures contract. Our weekly technical view warned of risk toward $44.50. This level was tested today, and prices remain heavy. Today’s 3.75% drop means that the October contract has now retraced 50% of this month’s rally (~$44.65). The 200-day moving average is a little lower at $44.35.
The technical tone remains weak. The five-day moving average is set to cross below the 20-day average in the next day or two. The RSI is trending lower and the MACDs have rolled over. The 61.8% retracement is found near $43.55 (green line). A break would likely signal a move toward $42. A few currencies are particularly sensitive to oil. They include the Canadian dollar, the Russian rouble, the Mexican peso, the Colombian peso and the Malaysian ringgit.
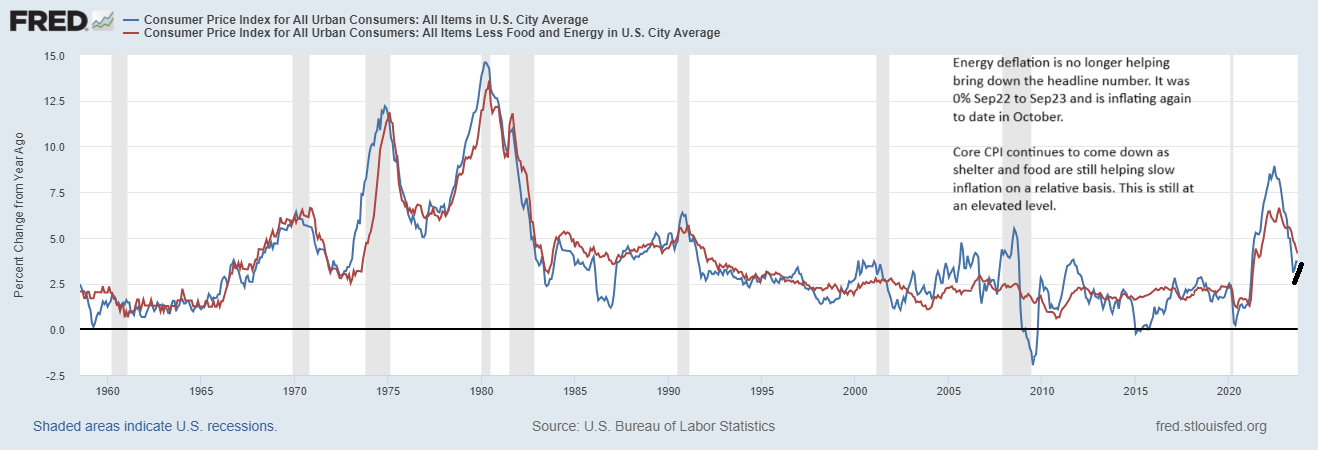
The pullback in oil prices is not have the usual impact on inflation expectations reflected by the 10-year breakeven (the difference between the conventional yield and the Treasury Inflation Protected Securities–TIPS). That breakeven has been mostly confined to a 5 bp range (1.45%-1.50%) with a few exceptions since early July. It is a little (less than half a basis point) higher today despite the drop in the price of oil today. One day a trend does not make, but the rolling 60-day correlation (on the percent change) has eased from 0.70 in late-July to less than 0.60 now.
|
Crude Oil Price(see more posts on oil price, ) Click to enlarge. |
He has been covering the global capital markets in one fashion or another for more than 30 years, working at economic consulting firms and global investment banks. After 14 years as the global head of currency strategy for Brown Brothers Harriman, Chandler joined Bannockburn Global Forex, as a managing partner and chief markets strategist as of October 1, 2018.
Tags: Great Graphic,newslettersent,OIL,oil price