Keith Weiner
My articles My offerMy siteAbout meMy videosMy books
Follow on:LinkedINTwitterSeeking AlphaFacebookAmazonGoogle +
Tricky and Dangerous Assumptions

Tricky and Dangerous Assumptions For at least a few weeks now, we have noticed a growing drumbeat from a growing corps of analysts. Gold is going to thousands of dollars. And silver is going to outperform. Reasons given are myriad. Goldman Sachs ap... - Click to enlarge
For at least a few weeks now, we have noticed a growing drumbeat from a growing corps of analysts. Gold is going to thousands of dollars. And silver is going to outperform. Reasons given are myriad. Goldman Sachs apparently said to short gold, so if one assumes that the bank always advises clients to take the other side of its trades — a tricky and dangerous assumption at best — then one should buy gold.
Then there’s the change in ETFs, for example the Sprott Physical Silver Fund has had inflows and Sprott bought more silver. And there’s currency wars, money printing, negative interest rates, etc. Most of these stories are based in fact (well except the belief that Goldman’s research is always wrong).
However, they have little to do with the price of gold. The money supply has grown steadily since 2011 while the prices of gold and silver have not. Hell, the money supply has been growing since forever. And the price of gold has gone up as well as down.
Something tells us that this effort to draw in buyers is concerted. Certainly there has been an 8.4% increase in silver held in trust for SLV. This is the result of relentless buying of SLV shares. When buyers push up the price of SLV relative to the price of silver, that creates an arbitrage opportunity for Authorized Participants.
They buy silver metal, create SLV shares, and sell the newly issued shares. They can do that as much as they want while there’s a profit to do so. But of course this pushes down the price of SLV until it is very close to the price of silver. SLV is somewhere between metal and futures. It can be a speculative play on price, but it’s bought with less leverage and it can also be a long-term holding for many people.
Another sign of increasingly bullish consensus is the discussion last week at Mines and Money in Hong Kong. If everyone agrees that price should go up, then that may indeed occur. The exchange-traded funds are being bought, which further supports a price rally, one that may be a bit more durable than these Yellen announcement rallies.
However, keep one thing in mind. The speculators are trying to front-run the hoarders. Speculators need to sell, to take profits or cut losses. What they can drive up, they can drive down ten times as fast. A durable rally can only occur if there is movement of metal out of carry trades sold to speculators, and into the hands of stackers.
But who knows? Such a rally could in turn spark hoarders to buy and the fundamentals could develop to support it. We keep saying that the price of the dollar will fall far indeed, it’s just that the time hasn’t been ripe yet.
Fundamental Developments
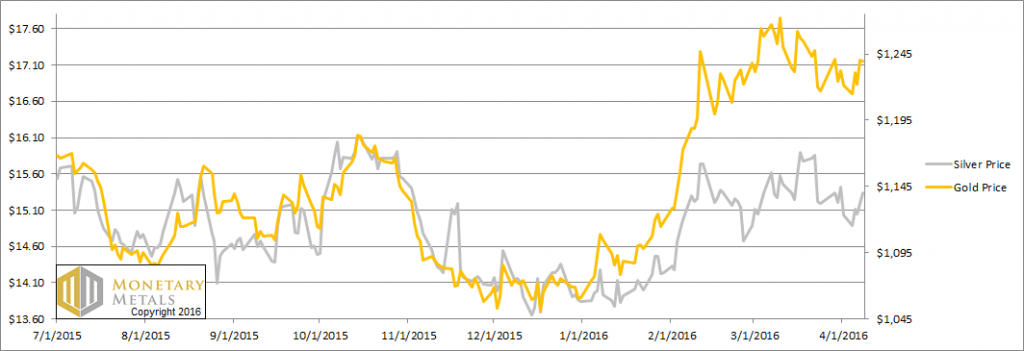
Gold and Silver PricesThe prices of the metals were up modestly this week. Let’s look at the only true picture of supply and demand fundamentals. But first, here’s the graph of the metals’ prices. Gold and silver prices – click to enlarge. |
 Tricky and Dangerous Assumptions For at least a few weeks now, we have noticed a growing drumbeat from a growing corps of analysts. Gold is going to thousands of dollars. And silver is going to outperform. Reasons given are myriad. Goldman Sachs ap... - Click to enlarge |
Next,
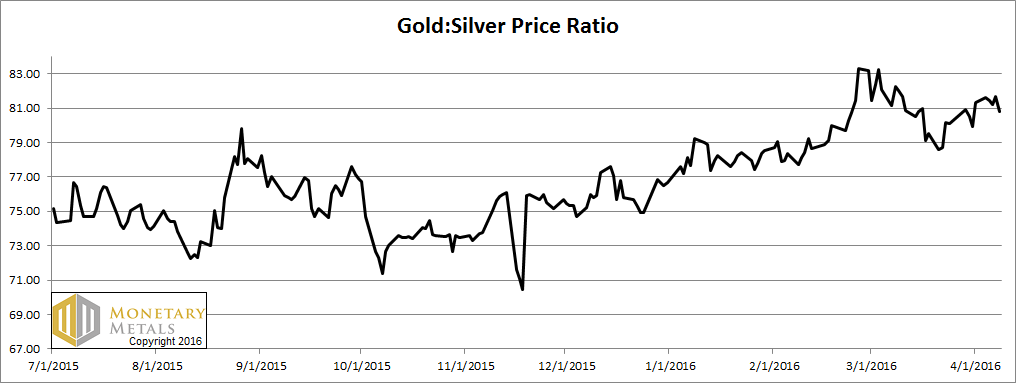
Gold-Silver Ratiothis is a graph of the gold price measured in silver, otherwise known as the gold to silver ratio. The ratio was down this week. Gold-silver ratio. |
 Tricky and Dangerous Assumptions For at least a few weeks now, we have noticed a growing drumbeat from a growing corps of analysts. Gold is going to thousands of dollars. And silver is going to outperform. Reasons given are myriad. Goldman Sachs ap... - Click to enlarge |
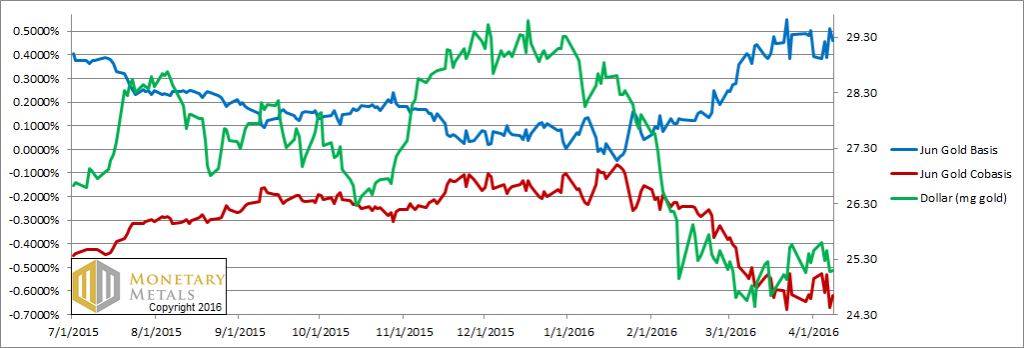
For each metal, we will look at a graph of the basis and co-basis overlaid with the price of the dollar in terms of the respective metal. It will make it easier to provide brief commentary. The dollar will be represented in green, the basis in blue and co-basis in red.
Here is the gold graph.
Gold basis and co-basisand the dollar price |
 Tricky and Dangerous Assumptions For at least a few weeks now, we have noticed a growing drumbeat from a growing corps of analysts. Gold is going to thousands of dollars. And silver is going to outperform. Reasons given are myriad. Goldman Sachs ap... - Click to enlarge |
After it separated in mid-March, the green dollar price line and the red gold scarcity line have been tracking once again. That is, gold becomes more scarce the more the dollar goes up (i.e. the more the price of gold drops). And vice versa.
The price of gold was up $17 this week, which is the same as saying the price of the dollar was down 0.36 milligrams. The cobasis, our scarcity measure, fell from -0.55% to -0.62%.
That said, the fundamental price moved up about $15. It’s almost a hundred bucks above the current market. Now let’s look at silver.
| Silver basis and co-basis and the dollar price – click to enlarge. | 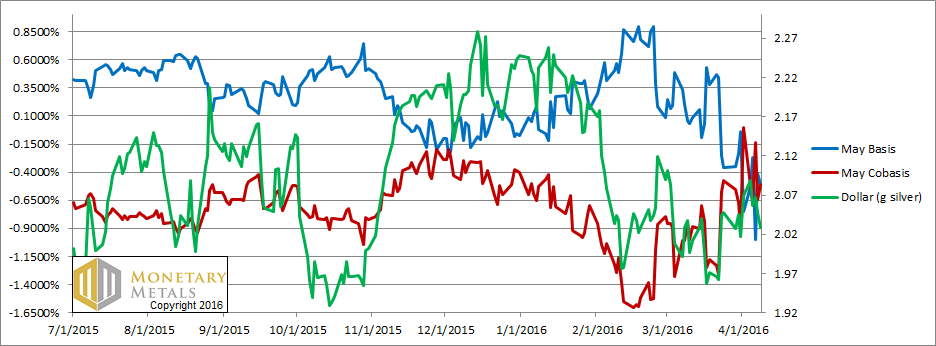 |
In silver, the scarcity would appear to be holding up better in light of the rising price. However, some of this is the distortion that formerly caused temporary backwardation. The May contract is under steady selling pressure, as naked longs have to sell before First Notice Day. For July by contrast, the co-basis is -1.1%. Last week, we said:
“If the May co-basis goes positive this week, it will be a recurrence of temporary backwardation. For years, we documented the tendency of each contract to tip into backwardation as it neared expiry. For silver it tended to happen a bit farther out than for gold. If it happens this week, it will not be particularly early compared to what we saw occur in contract in contract.”
As it turned out, the cobasis fell sharply. From 0%, it dropped to -0.66% by Tuesday. It bounced around from there, with quite a lot of volatility. Volatility approaching First Notice Day is to be expected, especially in the present regime where market makers are under more regulatory scrutiny. Our calculated silver fundamental went up a dime, which is de minimis.
We are in Singapore this week for Mining Investment Asia. Keith and Bron are both speaking.
Charts by: Monetary Metals
Dr. Keith Weiner is the president of the Gold Standard Institute USA, and CEO of Monetary Metals. Keith is a leading authority in the areas of gold, money, and credit and has made important contributions to the development of trading techniques founded upon the analysis of bid-ask spreads. Keith is a sought after speaker and regularly writes on economics. He is an Objectivist, and has his PhD from the New Austrian School of Economics. He lives with his wife near Phoenix, Arizona.
Full story here Are you the author?
Tags: Gold Backwardation,gold silver ratio,Gold-Cobasis,newslettersent,Precious Metals