Keith Weiner
My articles My offerMy siteAbout meMy videosMy books
Follow on:LinkedINTwitterSeeking AlphaFacebookAmazonGoogle +
A Spot of Irrational Exuberance
There were some fireworks last week. Gold went up on Tuesday (it was a shortened week due to Easter Monday), from a low of $1,215 to $1,244 over the day, a move of over 2 percent. Silver moved from $15.02 to $15.44, almost 3 percent. What happened on Tuesday to drive this move down in the dollar? (We always use italics when referring to gold going up or down, because it is really the dollar going down or up).
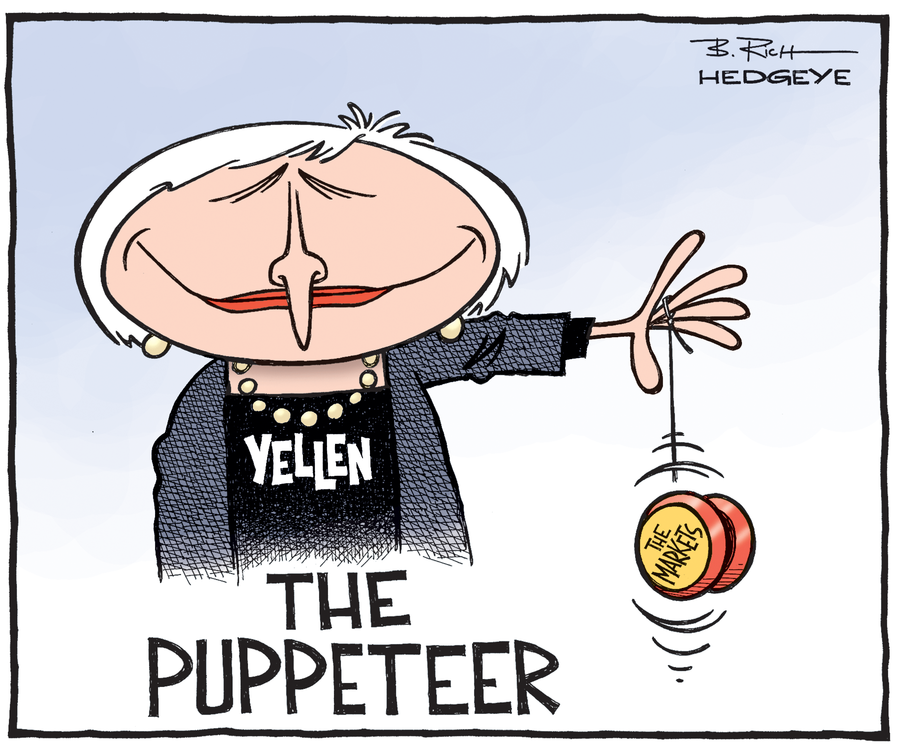 A bit of verbal puppeteering….
Janet Yellen happened, that’s what.
Our Federal Reserve Chair spoke to the Economic Club of New York. We won’t parse her words, but we can see what effect they had on the markets. Markets were up. The S&P surged 45 points, well over 2 percent. The British pound was up almost 2 percent. There was speculative mania, if not irrational exuberance, everywhere. Well almost everywhere. Crude oil was down almost 7% for the week.
When Pavlov trained his dogs to salivate at the sound of the dinner bell, he had to actually serve food. It would not have worked without the reward.
Thus, we remain puzzled at the market salivation at prospects of a greater money supply (or what passes for money nowadays, the irredeemable paper dollar). Why do speculators buy gold and silver at every Fed hint of greater money supply to come? Pavlov’s dogs had only the most rudimentary theory. Dinner occurs after that ringing sound. The market has a sophomoric theory. Higher prices will come after that printing sound. At least that’s the hope, which apparently springs eternal.
We thought we would graph the weekly money supply (MZM is Money of Zero Maturity), one of the measures tracked by the St Louis Fed and overlay the price of gold. We started the graph in April 2011, exactly 5 years ago. It happens to be just prior to the peak in the price of gold, but we don’t think we are cherry-picking the date. A five-year data set ought to be enough to show the trend or lack thereof, as we see in money supply growth and gold price growth respectively.
 The price of gold and MZM – click to enlarge.
Could these two lines be more different in character (or slope)? Based on seeing this graph, would you borrow money, and lever up to bet on a rise in the price when the Fed promises to keep that straight red line moving straightly?
Well, someone did on Tuesday. Or lots of someones.
Unfortunately for them, they were proven wrong fairly quickly. The price of gold ended the week just about where it started. The price of silver ended down. The gold to silver ratio resumed its northward march.
Fundamental Developments
Let’s look at the supply and demand fundamentals. But first, here’s the graph of the metals’ prices.
 Gold and silver prices – click to enlarge.
Next, this is a graph of the gold price measured in silver, otherwise known as the gold to silver ratio. The ratio was up this week.
 Gold-silver ratio – click to enlarge.
For each metal, we will look at a graph of the basis and co-basis overlaid with the price of the dollar in terms of the respective metal. It will make it easier to provide brief commentary. The dollar will be represented in green, the basis in blue and cobasis in red.
Here is the gold graph.
 Gold basis and co-basis and the dollar price – click to enlarge.
The green line is the price of the dollar, measured in gold terms (i.e. the inverse of the price of gold). The red line is the gold co-basis, our measure of scarcity of the metal. For many weeks, as it fell (i.e. the gold price rose) gold became less scarce. And when it rose, gold became more scarce. There was an almost uncanny tracking of these two lines (which is less pronounced in the June contract).
That relationship deviated last week, and we responded by dropping our fundamental gold price by a hundred bucks.
The fundamentals actually weakened during all that speculative buying on Tuesday, but firmed up later in the week. Our fundamental price ended the week up a few bucks, to just over $1,300. Gold is selling $90 below that, and it’s not a bad buy.
Now let’s look at silver.
 Silver basis and co-basis and the dollar price – click to enlarge.
Our scarcity measure, the silver co-basis, continues to show strength when the price of silver drops sufficiently (i.e. the price of the dollar, shown in green) rises. The May co-basis actually ended the week at 0.0000, just on the verge of backwardation. That said, the co-bases for farther months are still very negative, and didn’t rise as much proportionally as May. Here’s a graph.
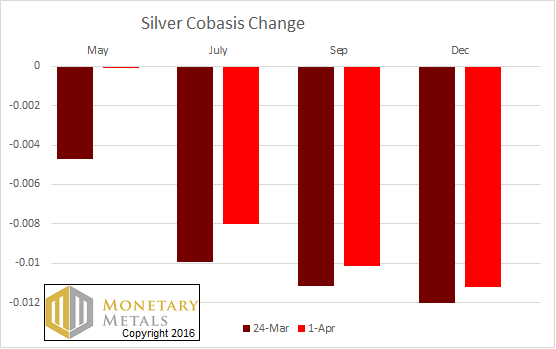 Change in the silver co-basis
Speculators sold silver off on Friday. And their selling was concentrated in the May contract.
If the May co-basis goes positive this week, it will be a recurrence of temporary backwardation. For years, we documented the tendency of each contract to tip into backwardation as it neared expiry. For silver it tended to happen a bit farther out than for gold. If it happens this week, it will not be particularly early compared to what we saw occur in contract in contract.
We have a silver fundamental price around $14.50.
We hope everyone enjoyed the Voldemort Effect, an article we released for April Fool’s Day. It was Bron’s first article since coming on board, and there will be many more.
Charts by: Monetary Metals
Dr. Keith Weiner is the president of the Gold Standard Institute USA, and CEO of Monetary Metals. Keith is a leading authority in the areas of gold, money, and credit and has made important contributions to the development of trading techniques founded upon the analysis of bid-ask spreads. Keith is a sought after speaker and regularly writes on economics. He is an Objectivist, and has his PhD from the New Austrian School of Economics. He lives with his wife near Phoenix, Arizona.
Full story here Are you the author?
Tags: Gold Backwardation,gold silver ratio,Gold-Cobasis,Janet Yellen,Precious Metals