Marc Chandler
My articles My offerMy siteAbout meMy videosMy books
Follow on:LinkedINTwitterSeeking AlphaAmazon

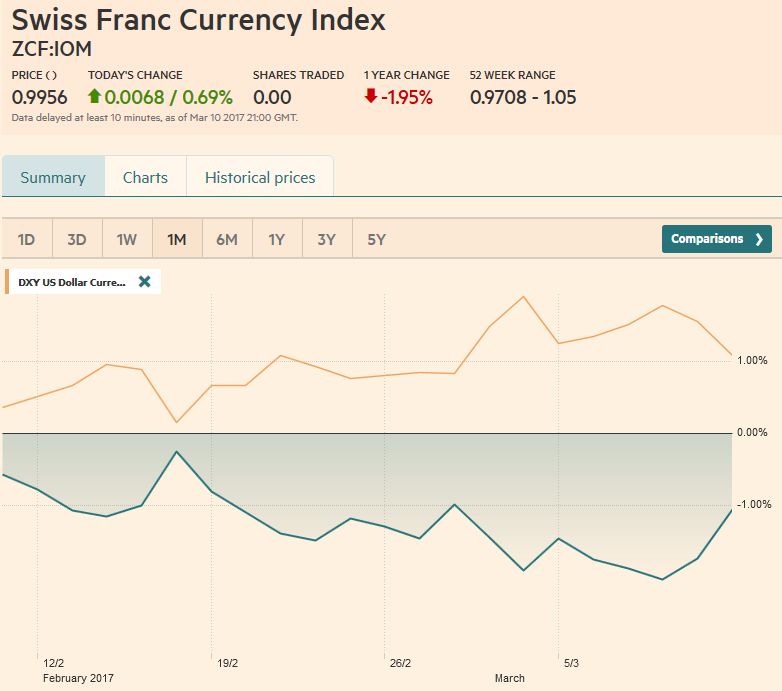
The reversal of the US dollar's gains half way through Draghi's press conference has undermined the near-term technical tone. The risk is on the downside, at least in the first part of the week, ahead of the FOMC meeting.
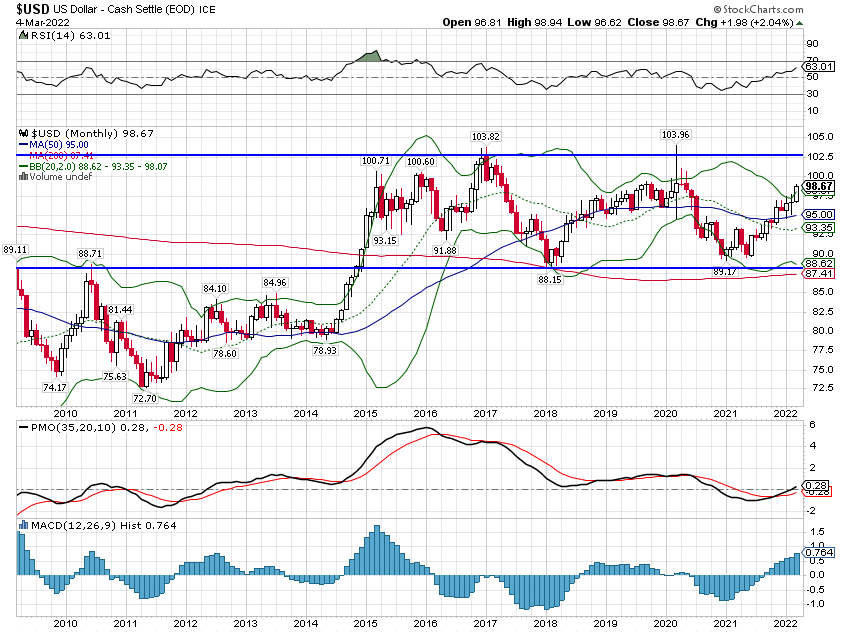
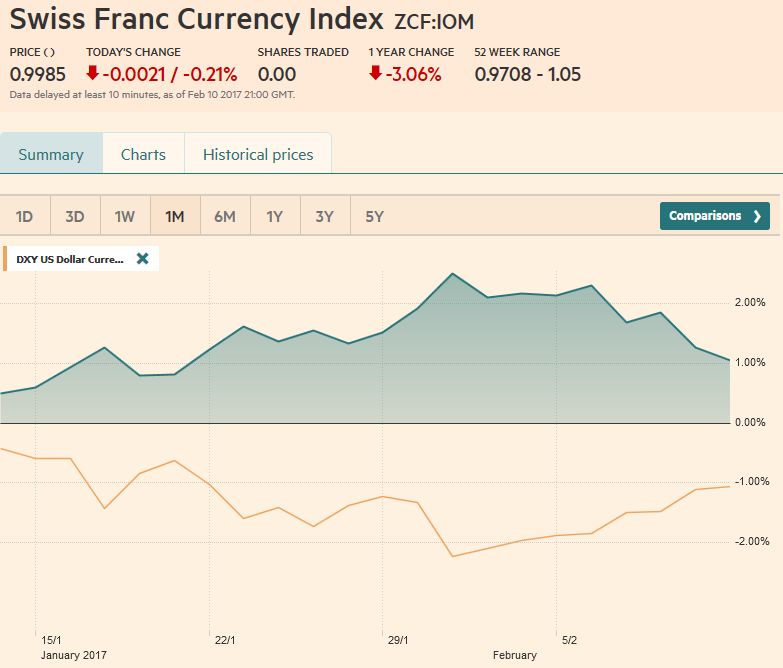
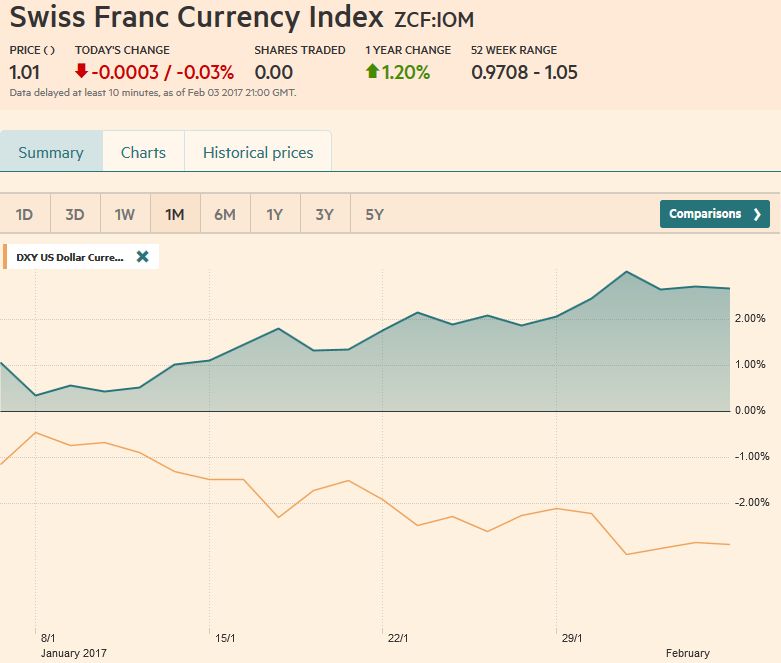
The US Dollar Index posted an outside down session on March 10. It drove the five-day moving average through the 20-day average, and turned the RSI and MACDs. Follow through selling ahead of the weekend was limited, but a break of 96.00 suggests potential toward year low set on February 11 near 95.25. Below there, last October's low near 93.80 comes into view. A move above 97.00 would help being repairing the technical damage.
Provided the euro holds above the $1.1040-$1.1060 area, it has potential toward $1.1300. That objective is the measuring target of the potential head and shoulder pattern the euro has traced prior to the ECB meeting. The euro's initial sell-off may obscured the pattern for purists, after all the euro briefly, albeit marginally, fell through the head of the pattern (~$1.0825 on March 2). However, and admittedly it is subjective and discretionary, we want to look past it.
The euro met the 61.8% retracement of its decline since the February high near $1.1375. For the past year, with the one exception of last August 28, the euro has been capped in the $1.1450-$1.1475 area. A break of that area therefore could be significant. However, with the US two-year premium over Germany widening to multiyear highs, we simply do not believe the incentive structure can fuel a sustained euro advance.
The US premium over Japan is widening (two and 10-year tenors) as well. The more robust appetite for risk seen in rising equities, high yields bonds, commodities and emerging markets would seem to support the dollar against the yen. However, the dollar looks capped in the JPY114.50 area. It has not been above there in nearly a month. Aggressive traders may anticipate another run in the dollar can take out JPY114, which corresponds to the top of a possible triangle pattern. The RSI and MACDs are slowly rising. Support is offered by the JPY112.00-JPY112.25 band.
Sterling is poised for more gains in the week ahead as it continues to recoup the initial Brexit-inspired losses. Before the weekend it was trading at its best level since February 19. It broke the downtrend drawn off the February 4 high with two successive closes above it to end the week. The technical indicators are constructive. Sterling can test $1.4500-$1.4540 in the days ahead. Support is seen ahead of $1.4250.
Sterling looks set to recover the losses it has suffered at the hands of the euro in recent months. The euro looks to have carved out a head and shoulders pattern against sterling, with the right shoulder sculpted by the price action in last couple of sessions. The neckline is near GBP0.7650, the measuring objective suggests a move toward the 61.8% retracement of the euro's gains since November, found near GBP0.7345.
The near-term outlook for the Australian dollar is also favorable. It finished last week at its best levels since last July. It is breaking out of a rectangle pattern, and has surpassed the 50% retracement objective of the big decline since last May that began near $0.8165. The 61.8% retracement is seen near $0.7650. The rectangle pattern, or some derivative of a double bottom, projects toward $0.7850, which corresponds to congestions from last June. The shift in sentiment is evidenced by the fact that the Aussie has been flirting with the upper Bollinger band for the past eight sessions.
The Canadian dollar shrugged off the widening of the US 2-year premium and a poor employment report to extend its advance. Since the US dollar's multiyear high was set on January 29, it has fallen by 10.5%. The recovery in oil prices, and the risk appetite more broadly, coupled with ideas that fiscal stimulus will reduce the chances of additional monetary support. The implied yield of the June BA futures is at its highest level since last June, as unwinding rate cut expectations continued last week. The US dollar has approached a two-year uptrend line that comes in near CAD1.3140. A break signals an immediate move toward CAD1.30, and then may CAD1.27.
The May light sweet oil futures contract has surpassed the April contract in open interest. It was capped last week every day in the $40.16-$40.48 band. Technical considerations are still constructive. Assuming the cap breaks, the next target is $41.35-$41.50, which corresponds to a previous high and a 50% retracement of the slide in prices since last October. A move above there would encourage a move to $44.00. On the downside, a break of $38 would undermine the constructive technical tone.
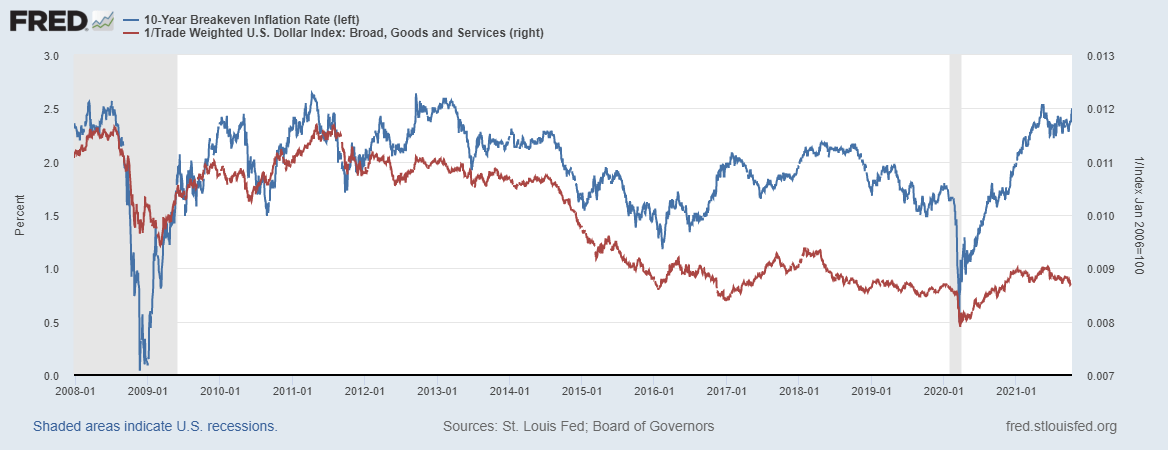
US 10-year Treasury yields rose seven basis points last week to 1.98% before the weekend, the highest level since the end of January. The 10-year break-even has risen by about 15 bp since the end of January. The lower yields abroad make US Treasuries more attractive. However, because of the cross currency basis swap pays to swap yen for dollars, some foreign investors have been buying JGBs and swapping the yen for dollars and locking in a better than Treasury yield. Last week, we suggested that the March 10-year note could test the 128-11 area. It fell to 128-21 before the weekend, the lowest level since January 29. The 128-00 area remains important. A break likely spurs a move to 127-00.
The S&P 500 advanced for the fourth consecutive week. It closed at its highest level since January 5, and almost 12% above the low seen on February 11. The S&P 500 followed the Nikkei and DAX in gapping lower on the first trading day of the year. The S&P 500 is the closest to it gap, which is found at 2038.20 to 2043.62 (according to Bloomberg data). Our analysis, anticipating a "W" shaped bottom and the breakout to the upside, projected the measuring objective from the double bottom toward 2100. For a technical point of view that still seems reasonable. Initial support is now pegged near 1995 and then 1988.
He has been covering the global capital markets in one fashion or another for more than 30 years, working at economic consulting firms and global investment banks. After 14 years as the global head of currency strategy for Brown Brothers Harriman, Chandler joined Bannockburn Global Forex, as a managing partner and chief markets strategist as of October 1, 2018.
Tags: Dollar Index