Until last September, the Federal Reserve seems to play down the market-based measures of inflation expectations, preferring the surveys that showed views were anchored. At the September 2015 FOMC meeting where the Fed had been expected to tighten until the August turmoil, officials cited among other considerations, the decline in market-based measures of inflation expectations.
There are many problems with using the spread between conventional Treasuries and the inflation-linked securities as predictions for future inflation. First, simply has a poor track record. In fact, a study by theSan Francisco Federal Reserve found two simple approaches are superior. One is to assume the Fed reaches its target every year. The other is to use this year's core rate for predicting next year's headline rate.
The other set of problems for using the breakevens as inflation forecasts is that there is a liquidity difference that impacts the spreads. US Treasuries are considerably more liquid than the inflation-protected securities. Market-based measures seem to reflect current and past inflation movements and provide little forward-looking information.
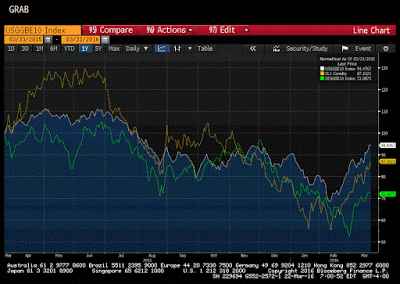
The Great Graphic, created on Bloomberg, shows three time series. The white line is the US 10-year breakeven. It had risen from 1.2% on February 10 to 1.65% yesterday. This is the highest since last August. The green line is the 10-year German breakeven. It has risen as well, but less so. It bottomed on March 1 near 68 bp and was a 94 bp yesterday.
The third line, in yellow, is the price of light sweet crude oil. The co-movement is striking though the German breakeven seems less tightly related to oil. The correlation between the US10-year breakeven and oil prices is a little more than 0.55 (60-day percentage change basis). This is where the correlation peaked twice in 2015. The last time the correlation was higher (than last year) was in 2011 when it was over 0.70.
Germany's 10-year breakeven is not as tied to the price of oil. The correlation between the German 10-year breakeven and Brent is less than 0.30 (60-day percentage change basis). It peaked last year near 0.50, which is the highest since at least 2011.
Bottom line: Rising oil prices lift all inflation expectations, but some more than others.
Tags: Great Graphic


