Marc Chandler shows that after the commodity currency Canadian Dollar, also the CRB Commodity index could have found a bottom. See here his Great Graphic on the CAD bottom buildung. See also the CAD resilience despite falling oil prices.
Marc Chandler shows that after the commodity currency Canadian Dollar, also the CRB Commodity index could have found a bottom. See here his Great Graphic on the CAD bottom buildung. See also the CAD resilience despite falling oil prices. - Click to enlarge
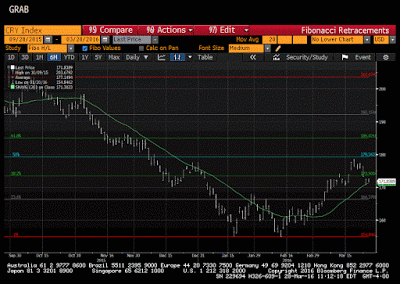
This Great Graphic, created on Bloomberg, depicts the CRB Index, a basket of commodity prices. The technical picture has deteriorated, and the price action in the coming sessions is particularly important in determining outlook.
The CRB Index put in a double bottom. On January 20 and February 11 lows were set just below 155.00. The neckline of the double bottom was created in the rally between the two bottoms. It is found near 168.00. The measuring objective is found by rotating the pattern on its neckline. It is near 181.00. On March 18, the CRB Index made a high just below 179.00, just ahead of the 50% retracement objective of the decline since the mid-October 2015.
The CRB Index gapped lower on March 24 and has not filled the gap today. It is found between last Wednesday’s low (~173.20 ) and last Thursday’s high (~172.57). It had gapped higher on March 17 but filled the gap on the large sell-off from March 23. If that first gap had not been filled, it would have left a bearish island gap in its wake.
On the downside, there are two levels to monitor, that if penetrated would strength the bearish technical case. The first is the 20-day moving average (~171.30). The CRB index has not closed below this moving average for a little over a month. The second and more important level is around 169.50. A little shelf was created near there earlier this month. It corresponds to a 38.2% retracement of the rally since the February low.
Given the high correlation between crude oil and the CRB Index (over 0.9 on a 60-day percent change basis), it is not surprising that the oil futures price action is quite similar. The May light sweet contract is trading heavily today near $39 a barrel. It peaked on March 18 near $42.50. It is toying with the 20-day moving average just above $39.00. The $37.70-$38.00 area corresponds to a 38.2% retracement of its gains since February 11 and the low on March 15. A break would signal a move toward $36.60 and possibly $35.


