We argue that the dollar is in its third significant rally since the end of Bretton Woods in 1971. The Reagan dollar rally was driven by the policy mix of tight monetary policy and loose fiscal policy. The G7 effort to stop the dollar's appreciation at the Plaza Hotel in September 1985 marked the end of the Reagan dollar rally.
After a nearly ten-year bear market for the dollar, that included the collapse of the Soviet Union, the fall of the Berlin Wall and the ERM crisis, there was a second dollar rally. The Clinton dollar rally was driven by the tech bubble. It too ended with G7 intervention (October 2000).
Both the Reagan and Clinton dollar rallies were preceded by rate hikes. This is not to say that all Fed hikes spur dollar rallies, but the two significant dollar rallies before the present were proceeded by the tightening of US monetary policy. The Clinton dollar rally also saw a fundamental change in the US approach to the dollar.
US Treasury officials, like Baker on the Republican side and Bentsen on the Democrat side, has threatened to devalue the dollar if a US trade partner, like Germany or Japan, did not acquiesce to US demands. Rubin's appointment to head of the Treasury Department changed this. The strong dollar policy meant that the US would no longer use the dollar's exchange rate as a lever to secure concessions. And indeed, since then, this has largely been the case.
In our analysis, the Obama dollar rally is being driven by the divergence between the US and most of the rest of the world. The US responded earlier and more aggressively to the end of the credit cycle than the eurozone or Japan. This is producing diverging economic outcomes a few years later.
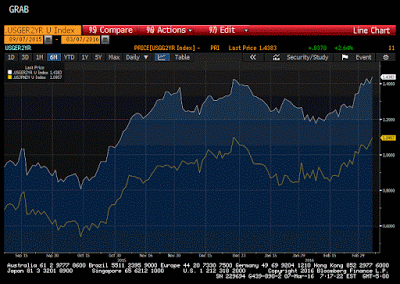
One metric of this divergence is the premium the US government pays over Germany and Japan. That is what this Great Graphic, created on Bloomberg depicts. The white line is the US 2-year premium over Germany. Today it is reaching its best level in almost a decade (~145 bp).
The yellow line is the US 2-year premium over Japan. It reached 110 bp today, the most since 2008.
The divergence is being driven by both components of the spread. Over the past month, the US 2-year yield has risen by 16 bp, while the German yield has fallen by six bp and Japan's 2-year yield as eased two bp. Over the past week, the US 2-year yield is up 11 bp, while the German and Japanese yields have edged about two bp higher.
There are many considerations that impact currency prices, but the interest rate differential often tracks the movement. To be sure, it is not as if a particular interest rate differential corresponds with a particular exchange rate. Rather we find the change in the interest rate differential often points to the direction of the currency movement.
Our work finds that typically the dollar-yen rate enjoys a higher correlation with 10-year interest differential than the two-year differential. Over the past 60-days, for example, the percentage change in the two-year spread has a 0.27 correlation with percentage change dollar-yen, while ten-year spread correlation is 0.43. The former is at the lower end of its range (half of what it was in early December) while the latter is at the upper end of the recent range). Typically, we find the US two-year premium over Germany is more closely correlated with the euro-dollar exchange rate though presently the correlations are almost identical.
Tags: Great Graphic


