Keith Weiner
My articles My offerMy siteAbout meMy videosMy books
Follow on:LinkedINTwitterSeeking AlphaFacebookAmazonGoogle +
There is a great lyric in Won’t Get Fooled Again by The Who:
Then I’ll get on my knees and pray
We don’t get fooled again
Remember last week, when the price of silver spiked? On Thursday that week, the price was moving sideways around $14. Then around 5am (Arizona time), the price began to rise. Before 11am, it had hit $14.38. And then it was all over. The price went downhill from there, the rest of the day and all day Friday. It closed at $13.93.
The same thing happened this Thursday, with the move beginning at $13.81 at 6am. Before 10, it hit $14.17. As we did the previous week, we tweeted near the top. “Silver run up… fundamental or speculative?” The price slowly slipped the rest of the day, and at 5am on Friday began to drop sharply.
Extra bonus points: guess which morning price moves got the silver bugs’ knickers in a twist? The sharp rises or the sharp drop, around the same time of day?
Anyways at 5am on Friday, the price began to spike once again, reaching $14.13 before 7am. But it couldn’t hold. It closed the day, and the week, at $13.90.
Three spikes in two weeks, reaching $14.38, $14.20, and $14.13. We don’t tend to emphasize price charting, but as a technical indicator this does not seem bullish. We will address the fundamentals of silver and gold, below…
But first, here’s the graph of the metals’ prices.
The Prices of Gold and Silver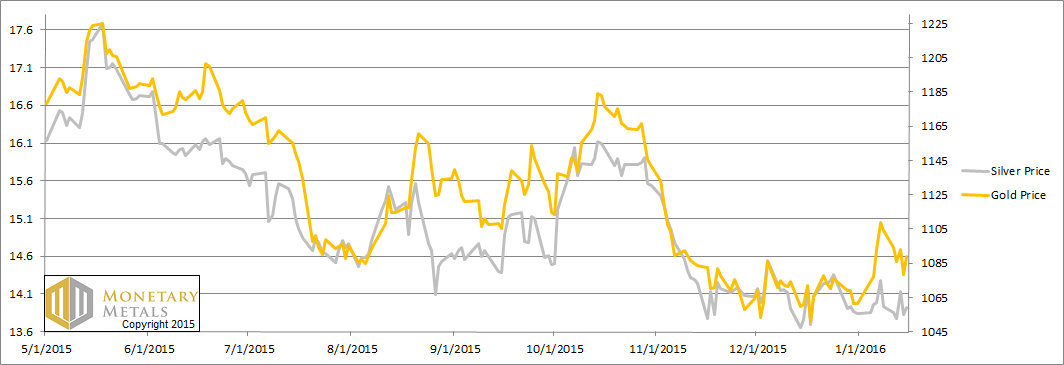
We are interested in the changing equilibrium created when some market participants are accumulating hoards and others are dishoarding. Of course, what makes it exciting is that speculators can (temporarily) exaggerate or fight against the trend. The speculators are often acting on rumors, technical analysis, or partial data about flows into or out of one corner of the market. That kind of information can’t tell them whether the globe, on net, is hoarding or dishoarding.
One could point out that gold does not, on net, go into or out of anything. Yes, that is true. But it can come out of hoards and into carry trades. That is what we study. The gold basis tells us about this dynamic.
Conventional techniques for analyzing supply and demand are inapplicable to gold and silver, because the monetary metals have such high inventories. In normal commodities, inventories divided by annual production (stocks to flows) can be measured in months. The world just does not keep much inventory in wheat or oil.
With gold and silver, stocks to flows is measured in decades. Every ounce of those massive stockpiles is potential supply. Everyone on the planet is potential demand. At the right price, and under the right conditions. Looking at incremental changes in mine output or electronic manufacturing is not helpful to predict the future prices of the metals. For an introduction and guide to our concepts and theory, click here.
Next, this is a graph of the gold price measured in silver, otherwise known as the gold to silver ratio. The ratio dipped this week.
The Ratio of the Gold Price to the Silver Price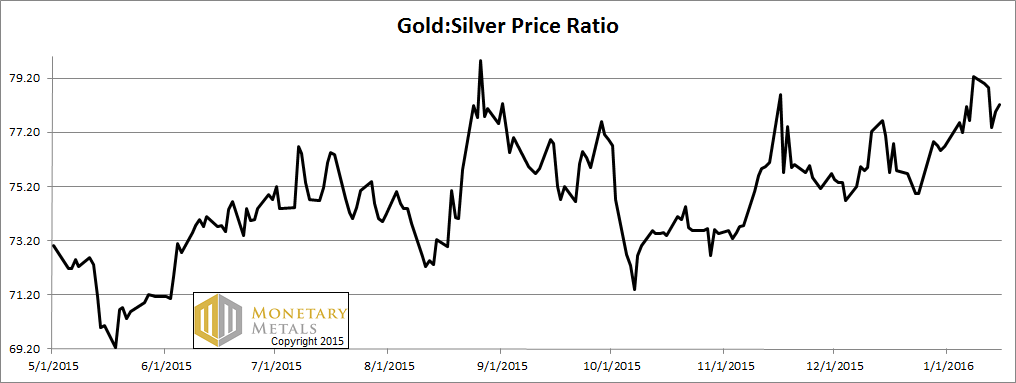
For each metal, we will look at a graph of the basis and cobasis overlaid with the price of the dollar in terms of the respective metal. It will make it easier to provide brief commentary. The dollar will be represented in green, the basis in blue and cobasis in red.
Here is the gold graph.
The Gold Basis and Cobasis and the Dollar Price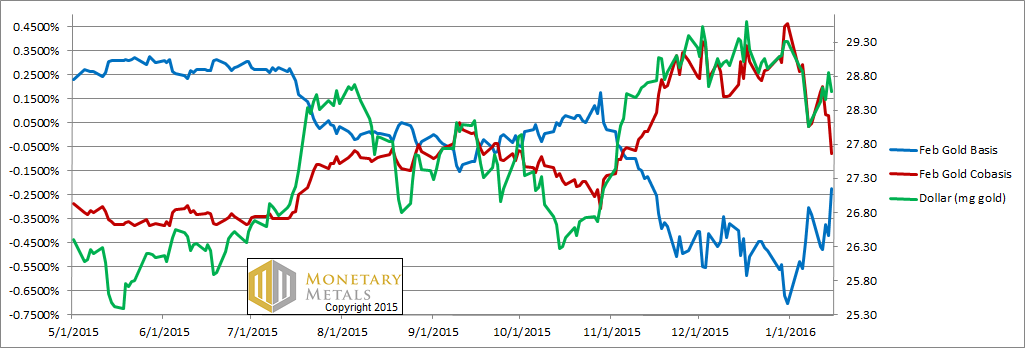
The red and green lines didn’t track so well this week. The price of the dollar is up (i.e. the price of gold, measured in dollars, is down). Indeed, the dollar went up .14mg, or as the muggles (a term from Harry Potter) would say, gold went down $15.
But the cobasis (i.e. scarcity indicator) of the metal went down. Gold became a bit less scarce, as it became a bit cheaper. Not a lot, and maybe it doesn’t mean that much in a week before a shortened holiday week next week (Monday is Martin Luther King day in America). But it happened.
Unsurprisingly, our fundamental price for gold dropped $33. It’s still $130 over the market price, but it’s less than it was (last week, it was $150 over the market and the market was $15 higher).
Now let’s look at silver.
The Silver Basis and Cobasis and the Dollar Price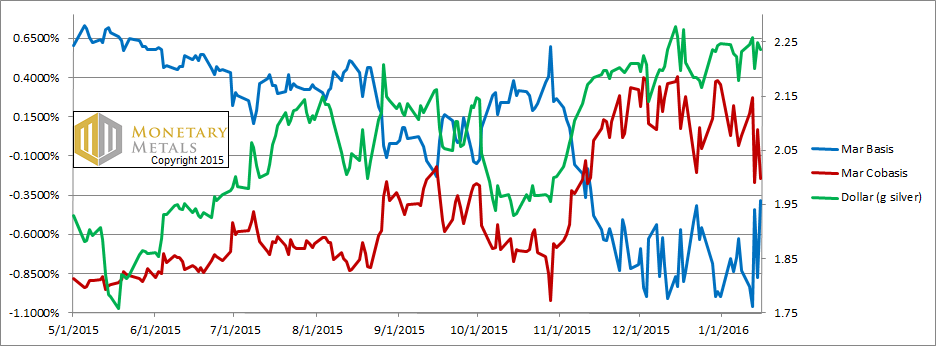
The price of silver was basically unchanged. However, note the big drop in the cobasis (more than twice as big as the drop in the gold cobasis).
The fundamental price for silver fell again this week, by 30 cents. It’s now 20 cents below the market.
We leave off this time with a curious chart.
The 10yr Treasury Yield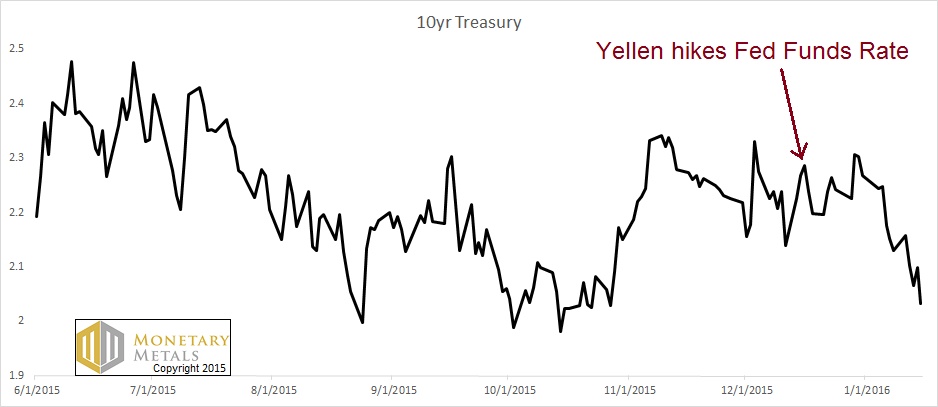
We see the same kind of noise in this chart as has spiked the silver chart three times in the past two weeks. The market gets worked up about something. In the case of the Treasury market, the issue was the coming Fed rate hike.
On October 28, the rate began to spike from under 2.1% to over 2.3% on November 9 (a move of 15.5 percent!) But then, the move proved unsustainable. The speculators, who were trying to front-run the whole world, ended up only front-running themselves. By this Friday, the bond yield was right back to where it started on October 28. The Treasury market took about two and a half months to do what the silver market has been doing in 24 hours.
During our years-long call for the silver price to fall, the price did sometimes correct (upwards) sharply. Some of those corrections lasted a while (though not in the past few weeks).
Our call for the interest rate is the same. We don’t expect it to go straight down, but we do expect the decades-long trend to continue. That trend is down in rate (i.e. up in bond price). This is not bullish for regular commodities, though we don’t expect gold and silver to behave anything like oil, copper, natgas, or corn.
© 2016 Monetary Metals
Tags: Current Market News,Gold,Gold-Cobasis