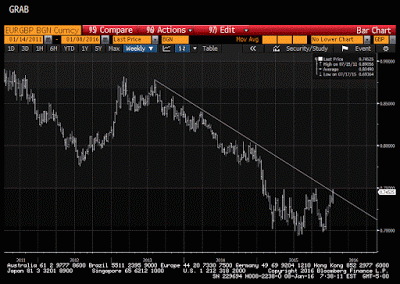
The euro appears to be carving out a bottom against sterling. This Great Graphic, created on Bloomberg, is a weekly bar chart of the cross.
We drew in the trendline off the high in H2 13. It catches a few highs in 2014 and is testing it this week.
Last year, the euro traded mostly between GBP0.7000 and GBP0.7500. A triple bottom near GBP0.7000 appears to have been recorded. This is a derivative of a head and shoulders pattern.
Although the trendline may be violated, we advise waiting for confirmation, which would be a close above GBP0.7500. The measuring objective is near GBP0.8000, which is near the 61.8% retracement of the decline from mid-2013.
The Bank of England is expected to raise rates before the ECB is done with its asset purchases program. However, market participants have been pushing out when the first hike will be delivered. This is illustrated by the fact that the December 2016 short-sterling futures contract is made new record highs yesterday (implying lower interest rates).
The implied interest rate has fallen 20 bp since the end of last week. Some observers also note the likelihood of the referendum on EU membership near midyear. A recent poll showed a slim majority of decided voters favor exit, which is widely seen by investors as ultimately sterling negative.Tactically, there seems to be two broad ways a short-term participant can trade this. The first is to buy the euro on a break out. The second way is to fade the patter. This entails selling the euro as it approaches the GBP0.7500 level. Which one is chosen is a function of personal views, risk-tolerance and time-frame.
Tags: Great Graphic


