There are many investors and observers who do not think the Fed ought to raise interest rates today.
The Fed's targeted inflation measure, the core PCE deflator, stood at 1.3%, well below the 2% target. They see the fresh sell-off in oil prices and are more concerned disinflation than inflation. Over the past week or so, more concern has been expressed about the sell-off in the high yield bond market.
Others are concerned about the strength of the dollar and the weakness abroad. Some economists express concern about the lackluster growth. Rather than accelerate as the year progressed, the economy appears to be growing slower in H2 than it did in H1, despite the mere 0.6% annualized expansion in Q1.
These doubts have given rise to speculation that the Fed will quickly realize the error of its ways and reverse the ill-conceived rate cut by the end of next year. Some argue that this is the same fate that has befallen every other high income central bank that has lifted rates since the crisis, including the ECB.
Surveys of investors and economists do not lend credence to such pessimism. Perhaps one of the reasons why the Fed has delayed hiking rates this long, even though unemployment is a little lower than the start of the last tightening cycle (though the core PCE deflator is also a little lower) is to feel confident that it can begin a normalization cycle with minimal risk a one-and-done unprecedented cycle.
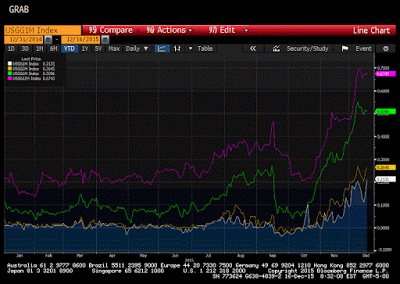
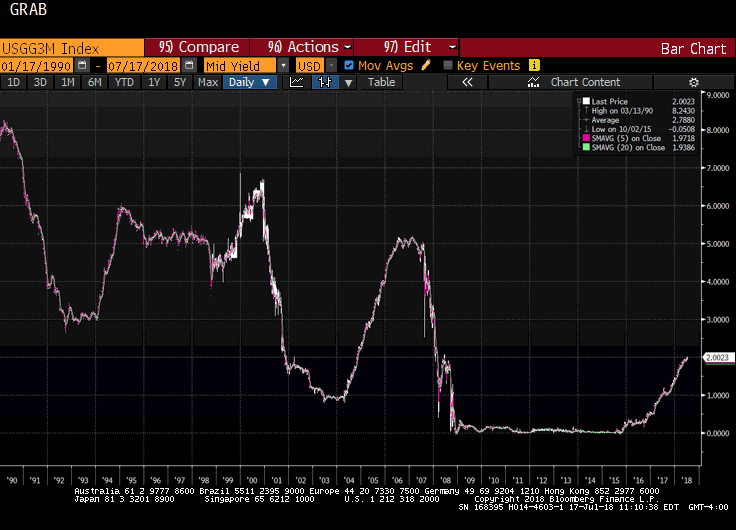
The Great Graphic composed on Bloomberg shows the yield on 1, 3, 6 and 12 month US T-bills. The dramatic increase in US bill yields reflect two developments. The first is that following the bipartisan deal on the debt ceiling, the US Treasury began selling more bills. This is to say that part of the rise in bill yields is a reflection of supply considerations. There was pent up demand that could not be satisfied before as the debt management ahead of the debt ceiling led to a dearth of supply.
Second, the rise in bill yields also reflects the upward pressure on US yields, especially at the short-end of the curve as the market anticipates the Fed hike. This is to say that while part of the increase in yields reflects supply considerations, there is also an expectations component.
Consider that the 12-month bill yield has risen from 20 bp in mid-October to 68 bp today. It was up to 76 bp a week ago. Ideas that the Fed would hike in September saw the US 1-year bill yield rise to 47 bp on September 16, the day before the FOMC announcement. The yield on the 12-month bill seems low. The September Fed forecasts pointed to a 100 bp hike next year. Even if it scales it back to 75 bp later today, there is scope for the 12-month bill yield to rise further.
The six-month T-bill is yielding 50 bp today. In mid-October the yield as seven bp. It reached almost 57 bp last week. The upper end of the Fed funds target range is likely to be 50 bp today. It is nearly double what it was before the Sept FOMC meeting. Supply considerations or really stronger demand, perhaps related to regulatory needs (incentives for some money markets to investment only in government paper) and/or a safe place to park funds leaving other risk markets, like the high yield bond market may be dampening yields. Year-end considerations may also play a role.
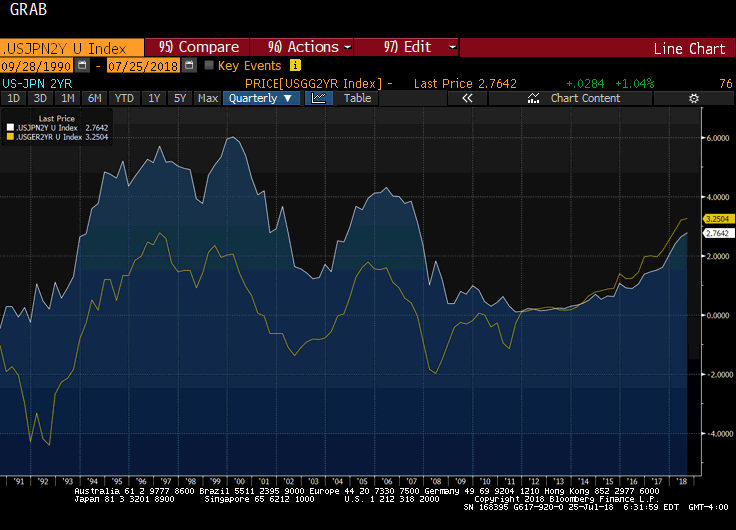
We suspect conditions may favor a return of the so-called Greenspan Conundrum. It was to denote the situation the Fed found itself in early 2005 when the Fed was lifting short-term interest rates, but long-term interest rates were stable to lower. Bernanke's explanation was that some Asian countries and oil producers had greater savings than they could absorb and were exporting it to the US. This time, we suspect that the unorthodox easing in some large countries and regions, the low oil prices, the modest growth and low inflation (even if not quite this low) may keep long-term yields relatively low in the face of Fed tightening.
Tags: Great Graphic


