Fundamentals with highest importance:
The HSBC Flash Purchasing Manager Index (PMI) for China weakened from 50.8 to 50.4. In particular, new export orders, output prices and employment started to decrease again, while output increased.
The preliminary Markit manufacturing PMI for the United States edged up to 54.3 (vs. 52.3 expected), a 9-month high after the low of 51.8 during the government shutdown last month. In particular, output and new orders improved.
Business expectations of the German IFO index rose to 106.3 (vs. 104.0 expected). They were close to their 2011 highs. Also the current assessment was better with 112.2 (vs. 111.6). Strangely, they were far smaller than the 2011 highs of 123.3. The German GDP increase of 0.3% QoQ (1.1% YoY) was confirmed in the second reading, the main drivers were investments and consumer spending, while imports finally rose more than exports. The shrinking savings rate of only 8.5% was hailed by Keynesian economists like Adam Posen, that previously critized the German export model based (here in Twitter discussion with the author). On the other side German newspapers are not happy about the 12-years low in savings.
High importance:
The October minutes of the Federal Reserve Open Market Committee (FOMC) indicated that several members would like to taper bond purchases in the next months.
U.S. retail sales improved +0.4% MoM vs. +0.1% expected. Retail sales ex. autos and gas were up 0.4%.
Consumer price inflation for the United States fell to 1.0% YoY (-0.1% MoM) mostly driven by the -4.8% YoY move in energy. Core inflation, however, is still at 1.7%.
According to Bloomberg, the ECB is considering a negative deposit rate of -0.1%. This news helped to depress the EUR/USD on that day by 0.8%. The Financial Times Alphaville believes that negative rates are helpful but contractionary. One day later, Draghi emphasized that negative rates have not been discussed recently.
The European manufacturing PMI improved slighly to 51.5 mostly driven by the strong German PMI of 52.5. The French one fell to 47.8. The German Services PMI improved to 54.5 (up from 52.9), while the PMI for the rest of Europe depreciated. This dragged the whole European Services PMI down to 50.9 (down from 51.6).
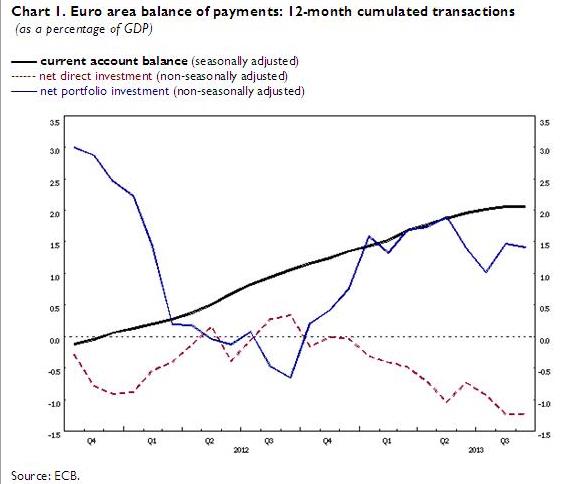
After the record-highs in Spring 2013 of 17 bln.€, per month, the September trade surplus in goods and services for the euro area fell to levels of 14.3 bln. €, which is 1.8% of (monthly) GDP. The recent tendency, however, was for rising European exports, while the contraction of imports seen until the spring stopped. The continuing European recovery attracted more foreign (e.g. American) portfolio inflows, about 50 billion € over the last 7 months. Only in the month of September, the US Treasury registered outflows of 106 bln. US$, after strong inflows of 50 bln. $ in May and July each.
The American NAHB housing market index continued its expansion at 54, but did not reach the highs of 59 achieved this summer.
Car registrations in the euro zone improved by 4.5% in October, mostly driven by a cash-for-clunkers-scheme in Spain (+34.4% YoY), +2.3% YoY in German and +2.6% YoY in France, while Italy lagged (-5.6% YoY). This was visible in the Spanish trade deficit that expanded back to levels seen end 2012, but made German car producers happy.
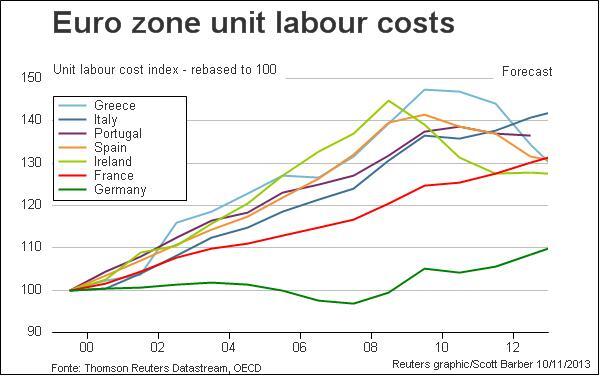
Italian contractual wages were up 1.4% YoY. As opposed to Spain, Greece or Ireland, Italian wages and labor costs seem to be downwards sticky, the consequence: higher unemployment.
Medium importance
Chinese house prices were up 9.6% against last year or 0.6% MoM.
In November the Philly Fed manufacturing index inched down to 6.5 (vs. 15.0 expected), the lowest level since May. Initial jobless claims declined more than expected to 323K.
Norwegian mainland GDP, which excludes volatile petroleum and ocean activities, was up 0.5% in Q3 after a weak 0.3% in the second quarter.
The Australian RBA kept the policy rate unchanged at 2.5%, but is seen as slightly dovish and uncomfortable with the strong Aussie.
The Bank of England’s monetary policy commitee (MPC) said that the decline in unemployment was a little faster than anticipated.
The Japanese trade balance in October continued to deteriorate, the adjusted trade deficit was 1,09 bln yen, about 2% of (monthly) GDP. Compared with one year ago, imports increased by 26% and exports by 18%. In particular, imports of petroleum increased by 67%. Consequently, imports from the Middle East rose by 51% and Russia by 113%, while the Japanese managed to improve the trade surplus with the U.S. by 40% and nearly eliminated last year’s deficit with Western Europe. Given that all Japanese nuclear reactors are currently of out of production, consumer spending was recently hit by higher energy costs. Abenomics my depend on the reestablishment of nuclear power, but is politically difficult.
More on Emerging Markets:
The Singaporean GDP rose by 5.8% YoY or 1.3% QoQ (vs. a 1% contraction in the first estimate). Russian industrial production fell by 0.1% YoY, mostly driven by weaker manufacturing (-1.9% YoY). Mexican retail sales were 4% down against last year, but thanks to rising exports, the GDP improved by 0.8% QoQ (+1.3% YoY) after a -0.6% in Q2.
The Brazilian current account deficit increased to 7.13 bln. USD, which is 3.3% of (monthly) GDP.
FX Price Movements
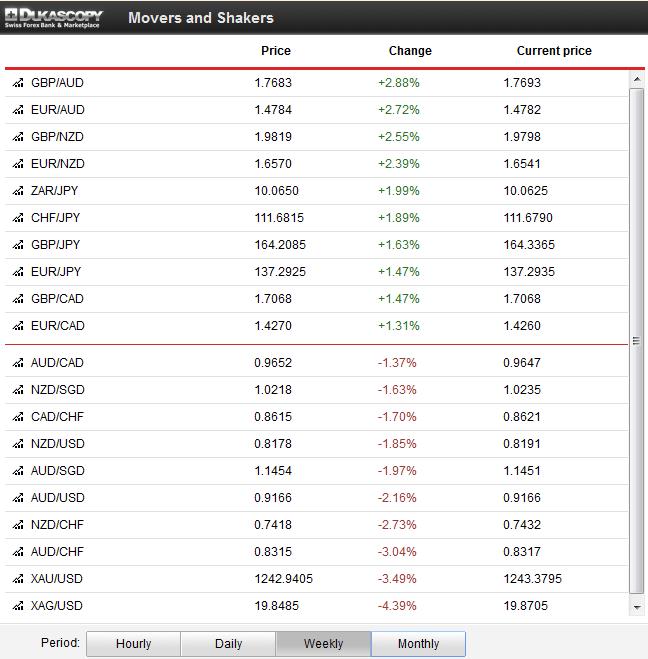
Thanks to the good German and bad Chinese data, the leaders of the week were the European currencies GBP, EUR, CHF and SEK, while the ones of the Asian bloc AUD, NZD, JPY and gold and silver lagged.
Since 2009, we have seen the FX world as a bipartite division into the American bloc and the Asian bloc, driven mostly by US and Chinese data. Chinese demand for capital goods was the main driver of German exports and GDP since 2009; Germany was somehow a slave of the Chinese expansion. On the other side, European spending helped Chinese producers until austerity also weakened China.
We are not sure if German spending is able to lead Europe out of recession and create something like a European bloc, driven by strong European spending, something that drove the euro up to EUR/USD 1.60 in 2007. At least this week, it looked like a concept like a European bloc could strongly influence FX rates.
On the other side the strong euro, thanks to good German data despite very weak French and Italian PMIs, showed that the main driver behind the euro is Germany and the other countries are important only during times of fear.
Swiss data and news
The Swiss trade surplus (source in German/Italian/French) for goods increased slightly to 2.43 bln. francs, about 4.5% of (monthly) GDP. The FX rate-sensitive machinery and electronics industry continued its recovery and increased exports by 6.7% compared to October 2012 (but -0.6% for the first 10 months of this year). The food industry was still the leader for the first 10 months while the previously very strong (and relatively FX-rate insensitive) chemical and pharmaceutical industry and the watch industry lagged with a nominal 3.3% and a 1.8% rise. Falling energy prices (-11% in real or 23% in nominal terms) helped to keep the trade surplus strong.
Gold, Silver and CHF
Due to the continued weakness in emerging markets, e.g. the bad Chinese PMI and the expanding Brazilian current account, gold and silver had a very bad week. This combined with new tapering fears drove gold down to 1242$.
Thanks to better German and weaker French and Italian data, the Germany-related Swiss franc improved by 10 bips against the euro, EUR/CHF 1.2296. The USD/CHF fell to 0.9070 by 0.64%.
Are you the author? Previous post See more for
Tags: American bloc,Asian bloc,ECB,European inflation,Federal Reserve,FX news,Germany Exports,Germany IFO Business Climate Index,Gold,Norwegian Krone,silver,Switzerland Trade Balance,U.S. Initial Jobless Claims,U.S. Retail Sales


