A couple of months ago the euro traded close to EUR/USD 1.20 and the whole world was betting on its breakdown.
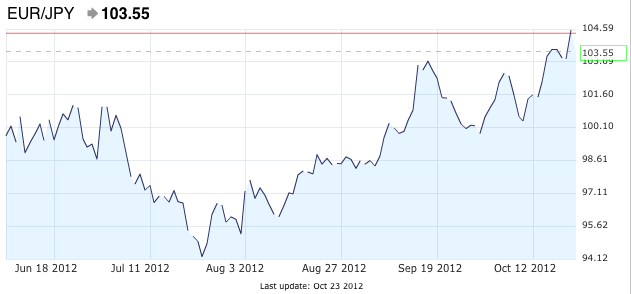
Once the euro downtrend ended thanks to QE3, OMT and euro zone current account surpluses, the common currency did not stop to appreciate against the yen and reached levels of EUR/JPY 104 and above. Many short euro positions needed to be short-covered and pushed the common currency even further up.
The 1930’s style of currency wars: Beggar your neighbor
A beggar-your-neighbour-1930-Great Depression style?
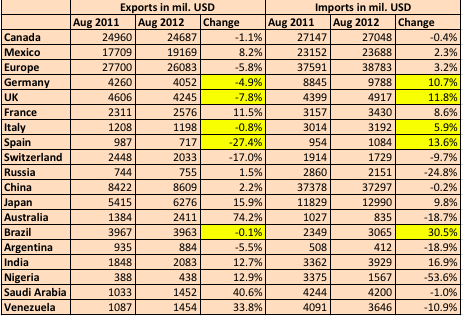
The latest Japanese trade balance data gives a clear evidence of what is happening:
Spain is the number one in import spending cuts with -32.1%, nearly any money left for Japanese cars or electronics. The rest of Europe looks not a lot better with -26%, just Germany marks an exception with -12.9%. But also emerging markets like China, Russia or Latin America and also Australia stopped their consumption rush. The only ones that still have deeper pockets are the United States, the Middle East and certainly Japan itself, as we see on the import side.
The Middle East took profit of the continuing generosity of the Fed, stronger Japanese oil imports and even weaker nuclear utilization rates.
Japan trade balance by country October 2012
Source
Oct 2012 Exports in mil. yen . Sept Exports in mil. yen Exports Oct. 2012 vs. Oct 2011 Exports Sept 2012 vs Sept 2011 . Oct 2012 Imports in mil. Yen . Sept 2012 Imports in mil. Yen . Import change vs Sept 2011 .
Total 5,149,993 5,359,752 -6.5% -10.3% 5,698,965 5'918'307 4.1%
China 947,766 953,834 -11.6% -14.1% 1,354,298 1'283'316 3.8%
Korea 394,167 398,563
-3.2% -4.7% 269,563 242'003 -5.8%
Asean 835,552 886,832 +3.7% -1.3% 815,736 886,832
Taiwan 299,979 316,889 -5.3% 3.2% 180,376 157,238
Australia, NZ 134,458 158,316 -21.3% -19.8% 397,937 415'361 2.1%
North America 989,519 998,939 +3.4% 0.4% 600,580 585'300 2.5%
Latin America 269,390 273,909 -17.0% 247,499 219'275 2.9%
Western Europe 526,663 585,936 -23.5% -26.0% 628,625 573'273 -3.0%
(of which Germany) 132,834 144,224 -17.2% -12.9% 169,561 154'489 -7.9%
(of which Italy) 22,843 23,110 -28.9% -31.0% 72,872 23,110
(of which Spain) 15,115 16,575 -38.0% -32.1% 27,678 23'335 8.1%
(of which UK) 85,584 101,960 -12.6% -31.2% 49,634 43,575 -32.7%
Russia and other CEE 79,286 128,701 -19.8% -23.0% 139,719 161'756 -8.5%
Middle East 189,249 181,035 0.1% -0.3% 870,364 1'242'800 20.8%
Africa 72,290 88,410 3.8% -12.9% 129,705 131'046 3.1%
The trade balance of the United States exhibits a similar tendency. The US exports to these countries fall or remain stable, but imports increase. As opposed to Japan, the total of exports and imports did not change significantly:
The euro zone (with the exception of France) and the UK continued to increase exports to the US, but they slowed spending and reduced imports.
Or might it be completely different?
Given that Japan has a negative trade balance now, it is Japan that has a debt problem. This is the second part of this analysis thanks to Ron Rimkus.
Some of the best-known research on financial crises asserts that countries get into trouble when debt-to-GDP ratios surpass 80%. With a national debt that now checks in at roughly 220% of gross domestic product, Japan, at least by rule of thumb, should have collapsed a long time ago. Yet Japan has — thus far — somehow avoided a debt crisis.
In fact, many investors have bet against Japan over the years . . . and lost. A common mistake over the past two decades has been shorting Japanese government bonds — trades which have mostly ended in a trail of tears. In a country where interest rates have moved slowly but consistently lower over the past two decades, investors who have gambled on the thesis that Japan’s financial structure is unsustainable have been forced to learn one of the harshest lessons of investing: There is little difference between being early and being wrong.
So, how exactly have interest rates in Japan remained so stubbornly low in the face of a persistently stagnant economy and high and growing debt? Why aren’t investors demanding higher rates of return? Can this economic anomaly continue? If so, for how long? If not, when does Japan cross the event horizon for a major shift in fortunes?
The answers to these questions have proven so elusive over the years that I figure it’s time to try to get to the heart of the matter. After all, it’s not just about Japan: A better understanding of Japan’s fragile economic imbalances sheds light on current events in Europe and the United States, which, in the aftermath of the 2008 financial crisis, have implemented policies similar to those that have been pursued by Japan.
The story begins with Japan’s post-war economic miracle. In order to rebuild its economy after the devastation of World War II, the Japanese government adopted an export model to boost export growth and import know-how. Japan invested heavily in education, research and manufacturing. A key element of the export model is, of course, accommodative monetary policy whereby a country uses credit creation, infrastructure development, and lower-than-market interest rates (known in monetary parlance as “financial repression”) to focus the country on exports. As the original “Asian Tiger,” Japan employed this strategy to great effect over the years, growing GDP sharply on the back of strong exports. As long as GDP and exports are growing, this model works. But when GDP stops growing and exports slow, the model fails. The point of failure for Japan was when its easy monetary policy stimulated a real estate and stock market bubble instead of fueling exports.
In 1985, the major economies of the world (United States, Japan, West Germany, France, and the United Kingdom) coordinated the Plaza Accord to reduce the value of the dollar relative to other major currencies (including the yen) with the specific intent of reducing trade imbalances. In the 24 months after signing the accord, the yen appreciated by 50%. By mid-1986, the rising yen had forced Japan into a recession (because the stronger yen harmed the country’s exports).
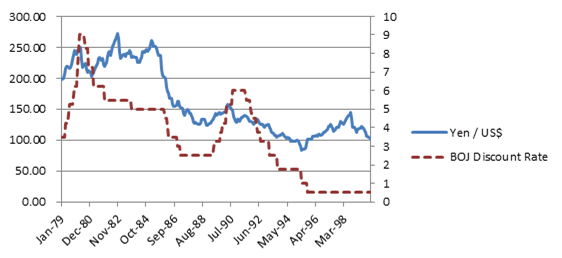
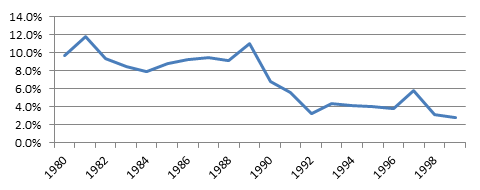
As illustrated by the dotted line in Figure 1, the Bank of Japan (BOJ) responded by reducing the official discount rate five times between January 1986 and February 1987, leaving it finally at 2.5% — which remained in effect until May 1989. The BOJ was ferociously trying to stimulate the economy with aggressive easing. In addition to low rates, the BOJ maintained high levels of money supply and credit growth, which drove the creation of the bubble as illustrated in Figure 2.
Figure 1: Yen Exchange Rate and BOJ Discount Rate
Sources: Bank of Japan, CFA Institute.
Figure 2: Percent Change in Money Supply (M2)
Sources: World Bank, CFA Institute.
The bubble manifested itself in both real estate and the stock market. It finally popped as the BOJ raised interest rates in 1989–1990, with historic collapses from which — even now, some 22 years later — the country has not recovered.
Nevertheless, Japan has been able to finance itself at extremely low rates during those 22 years. How? The financing of federal governments is much more complicated than the simple taxation of citizens. Governments finance themselves through some combination of direct taxation of citizens, taxation of businesses, tariffs on imports from other countries, build-up and usage of foreign currency reserves from international trade, issuance of debt, and money printing (if possible). Therefore, Japan’s ability to finance its federal government will be determined by the health of its GDP growth (which grows tax revenues, all else equal), its ability to grow federal tax revenues, its ability to control its budget, its ability and willingness to use its substantial foreign exchange reserves, and perhaps most importantly, its ability to continue selling bonds to the public. The secret of Japan’s ability to finance itself over the past 22 years is that it has used its current account surplus to create a closed loop — more money flows into Japan than flows out, and that net inflow is largely invested in JGBs (Japanese government bonds).
Here’s how it works: on the trade side, Japan exports more than it imports bringing more capital into Japan than leaving. Japan has maintained a trade surplus for about 30 years. And because of this persistent trade surplus, Japan has built up a large portfolio of foreign currencies. These foreign currencies are then invested in foreign assets (e.g., U.S. Treasuries) earning Japan a steady stream of income. Because this portfolio is large, Japan — as a country — regularly earns more income on its foreign currency holdings than they pay out to foreign investors. In combination, the trade surplus and the income surplus brings new money into corporate Japan. Corporate Japan places that money into the banking system, which then gets levered up and dramatically expands its purchasing power. Then the banks, life insurance companies, and pension funds turn around and buy lots of JGBs (accompanied with much pressure/regulation by the Bank of Japan).
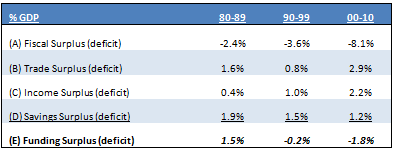
In fact, the major banks, such as Bank of Tokyo-Mitsubishi UFJ, Sumitomo Mitsui, and Mizuho, regularly buy JGBs — even viewing it as a “public mission” to support Japan. In addition, the Bank of Japan buys lots of JGBs on the open market, trying to drive up prices and drive down yields, thereby manufacturing low rates. While this monetization of debt creates inflationary pressures, it has thus far been offset by the deflationary pressures of a declining workforce and declining population. There are short-term fluctuations from year to year, but it is clear when looking at averages decade by decade that funding pressures in Japan have been growing over time.
Table 1: Breakdown of Funding Surpluses/Deficits as a % of GDP
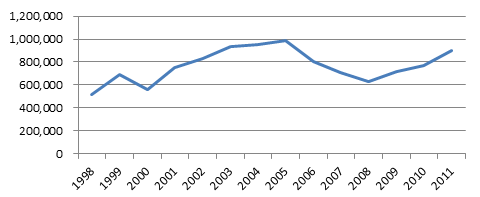
As you can see in Table 1, this is the answer to the original question. This cash flow cycle is how Japan has funded itself over the past 22+ years. Only now, the profile is changing. The Japanese debt crisis is being spawned by a burgeoning fiscal deficit. As the fiscal deficit has expanded, it has placed greater pressure on the Japanese government to sell debt and on the Bank of Japan to purchase it. Of course, the BOJ has been stepping in and buying JGBs when corporate demand has not been strong enough to keep rates low, as illustrated in Figure 3.
Figure 3: JGBs Owned by the Bank of Japan (in ¥100 mm)
Sources: Bank of Japan, CFA Institute.
Although Japan probably still is often thought of as a high-saving society, this is no longer true, at least for households. Japan’s household savings rate is now around 2% (down from a peak of 44% in 1990). So, in combination with chronic, large fiscal deficits, Japan’s low bond yields appear to present an oxymoron. However, Japan has also maintained a high corporate savings rate and low levels of fixed investment (both residential and nonresidential), making Japan a net exporter of capital. However, its fiscal profligacy is catching up with it: Its fiscal deficit has risen to more than 11% of GDP, where it remains today.
Up to now, Japan has been able to finance this funding deficit, as illustrated in Figure 4, primarily by issuing bonds. Historically, these bonds have been purchased by the public through various channels, ranging from household purchases to corporations to domestic banks to the post office. However, the aging of Japan’s population is altering the fundamental demand structure for bonds.
Figure 4: Japan: Bonds Issued as a Percent of GDP
Sources: Ministry of Finance, CFA Institute.
Although the aging of Japan’s population has been much discussed over the years, it is just now beginning to manifest itself — and as people become old, they tend to spend their savings rather than accumulate more savings — a process known as dissaving. Ominously, Japan’s population declined for the first time in 2009 (and has been declining ever since). Already about 30% of Japan’s population is elderly; that figure is expected to grow to about 40% over the next 30 years or so. And given Japan’s welfare society system, their (shrinking) working-age population will save less and less as their burdens in supporting the dependent-age population (both young and old) grow more and more. According to a McKinsey study, savings rates in Japan decline markedly after people turn 50 years old. Given its demographic profile, Japan’s combination of aging and life cycle effects will continue unabated.
At present, Japan has just over 127 mm people. According to the National Institute of Population and Social Security Research, Japan’s population — 20 years from today — will shrink to about 118 mm by the year 2032 (with an even greater deceleration in the working age population). Today, Japan’s GDP per capita stands at about ¥3.7 mm per person. Assuming they can maintain this level over time and keeping inflation neutral, Japan’s GDP would shrink from ¥476 trillion today to about ¥442 trillion in 2032. Given the ongoing massive fiscal deficits which Japan finances through similar levels of debt issuance, their national debt levels will rise to ¥2.4 quadrillion (rising from ¥980 trillion today). Another big question mark is of course interest rate levels. Even assuming their average interest cost on debt remains unchanged from today’s levels, Japan’s debt service will consume over 50% of the federal budget by 2032 (up from 23% today). With a populace that does not favor immigration, it seems that the die is cast. Japan will inevitably age and shrink — but not its debt.
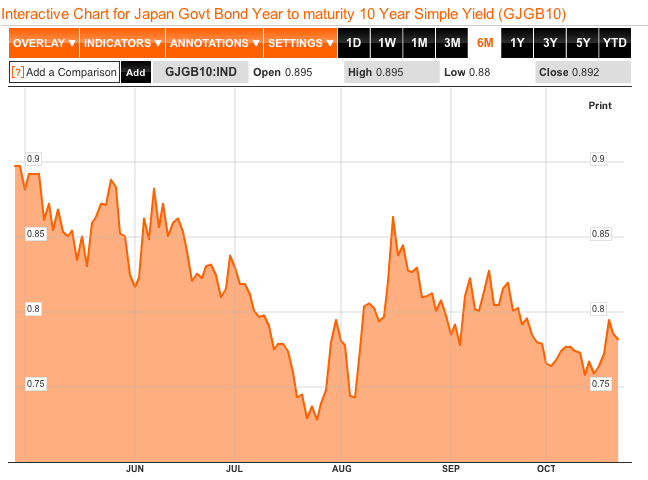
Japanese 10 year yields are still at 0.77%, they reacted to positive US economic data last week and rose, but this week not at all to. Potential Japanese debt issues seem to be far.
Japan is by far not Greece or Spain. 95 percent of JGB holders are locals, only 5% are foreigners, mostly central banks.
Are you the author? Previous post See more for Next post
Tags: Asset Price Bubble,asset prices,Bank of Japan,consumer spending,Currency Wars,current account,debt,Eurozone,Federal Funds Rate,Japan,M2,Ministry of Finance,MoF,monetization of debt,money printing,PPI,Trade Balance,trade surplus,U.S. Trade Balance,U.S. Treasuries


