The years 2009 to 2011 have seen four institutions that created bubbles in commodity, stock and real estate markets.
2008 and 2009 saw the massive Keynesian interventions by the US state and the Chinese government. In 2009 the first Quantitative Easing measures enabled a first flood of hot money into Emerging Markets. Summer 2010 witnessed a similar flood of cheap money with QE2 into the Emerging Markets to which Chinese, Brazilian and Indian policy makers needed to respond with interest rate hikes and capital restrictions. The bubble bursted in Summer 2011, triggering a tremendous money flow back into the United States, treasury bonds and into the S&P 500.
Thanks to the newly received money the United States has restarted a recovery especially when measured via consumer confidence. The Emerging Markets, however, are still struggling with food inflation and a housing bubble that do not allow for a cut in interest rates. In March 2012 the Chinese government has decided to accept a slower of growth of 7.5% in China. In this essay we will show how the share of state investment has been reduced between 2005 and 2012 and what this means for further Chinese development. Also we look on the second wave of investments into China, namely the real-estate sector.
The Chinese Government
Fixed Asset Investment as part of the Chinese GDP
As well known also by Krugman the part of fixed asset investment in the chinese economy is very high. In 2007 investment accounted for 42.7% of the country’s Gross Domestic Product. Investments made up only 23.9% of GDP in Japan, 20.2% in the United States and 17.45% in Germany.
Inside the Fixed Asset Investment the part of the state and the one of housing is very big.
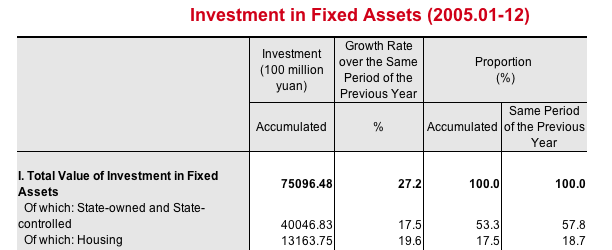
The 2005 Investment in Fixed Assets showed only an increase of 19.6% in housing as compared to the total 27.2% rise in fixed-assets investments.

This successively increased from 26.8% housing vs. total 24.5% rise in 2006. Then followed again by an over-investment in housing, a rise of 30.2% vs. 25.8% total in 2007. The financial crisis slowed the unnatural rise in housing down to 20.9% vs. total 26.1% in 2008. Due to continued fears of housing investments during the financial crisis the investment in housing was a lot slower in 2009 than the total rise in fixed-asset investments with +17.8% whereas total fixed asset investments strongly expanded by 32.1% thanks to strong governmental investments.
But thanks to Quantitative Easing and foreign investments already in 2010 the chinese economy turned back to growth via real estate investments. Housing rose by 33.2% whereas the total fixed-asset investment increased by 24.5%. The proportion of housing in total fixed-assets to 20% vs. 17.5% in 2005.
Thanks to the PBC tightening policy construction stopped the strong rise in 2011 and slowed a bit to + 27.9% vs. a total value of + 23.8%, still showing signs of an over-investment.
Surprisingly the tendency continues in the first quarter of 2012: Even if the pace of total investment growth has slowed to 20.9%, housing still beats total investment growth and takes now even 22.8% of total new investments, whereas state investments have radically slowed down.
Interestingly house prices have already started to fall but construction is still strongly on the rise, a situation comparable to the one in the United States in 2005, when prices topped, but the real estate boom still continued for another two years.
Phases in the Chinese business cycles
We can clearly make up three different phases in the chinese business cycle:
Phase 1: Strong investment into machinery and infra-structure by the chinese state (see 2009 or 2005 above)
This strong expansion in central planning has by decision of March 5th finished and is manifested in the slow increase of 9% of state investments.
Phase 2: Private (local and foreign) investments especially into real estate.
This phase might continue another 2-3 years.
Unfortunately we are missing still the third phase:
Phase 3: Strong consumer spending
Average disposable income per year was at 21734 Yuan (3440 USD, 16301 Yuan in the quarters 1-3, 2011), an increase of 13.7%, or in real terms of 7.8%.
Disappointing Easing Measures
The cut of the Reserve Requirements Rate (RRR) from 20.5% to 20% is nothing but a signal similarly as the Fed signaled that it would provide further Quantitive Easing if required. For both central inflation is still too high to intervene. Furthermore even if the PBOC has learned already last year that economic growth merely based on real estate investment is not sustainable
Are you the author? Previous post See more for Next post
Tags: China,consumer spending,food inflation,Keynes,QE2,Real Estate,Swiss National Bank,U.S. Consumer Confidence


