Tag Archive: United States
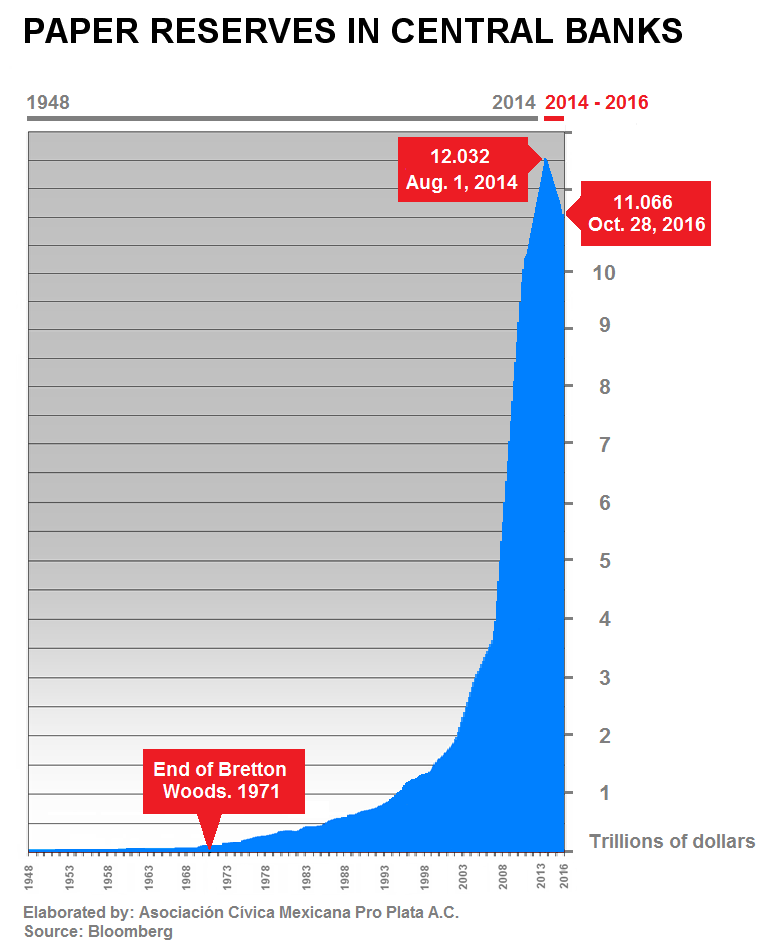
How Long Will the Dollar Be the Major World Reserve Currency? A Look at Wealth
We examine how long the U.S. Dollar will remain the unique world reserve currency. The most important criterion for being a reserve currency is wealth. While China has recently overtaken the U.S. as for inflation-adjusted GDP, in the next step, it will overtake the U.S. as for wealth.
Read More »
Read More »
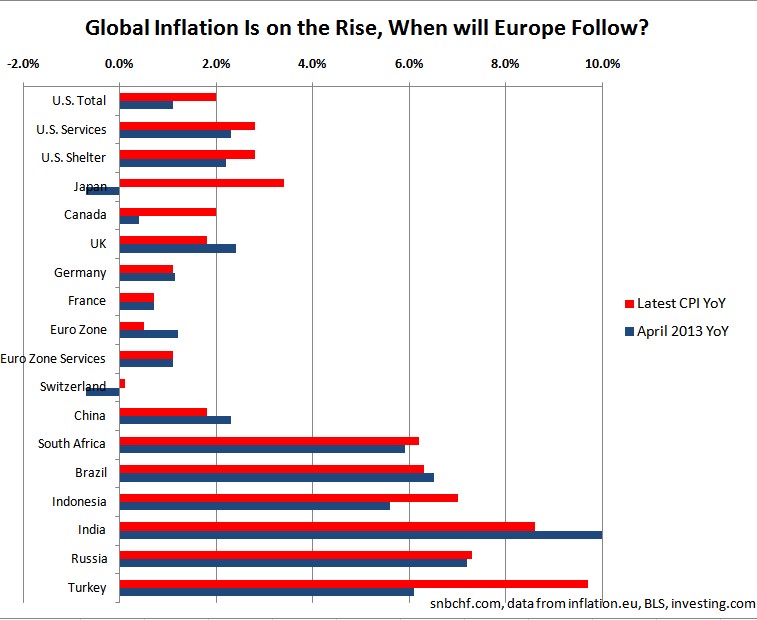
Global Inflation Spikes Up, Are You Sure About What You Are Doing Mr Draghi?
The European Central Bank (ECB) has the habit of reacting late. As seen in July 2008 and July 2011, the ECB is often the last major central bank to hike rates. They hike rates at the moment when others prepare for a recession or a significant slowing. Currently we are witnessing the opposite movement: The world is getting … Continue...
Read More »
Read More »
Labor Participation Rates: Falling in the Ageing U.S., Rising in Ageing Germany and Crisis-Hit Italy
The most effective ways of measuring employment is by looking at the Labor Participation Rate. We compare the participation rates of the United States, Canada, the U.K., Germany and Italy.
Read More »
Read More »
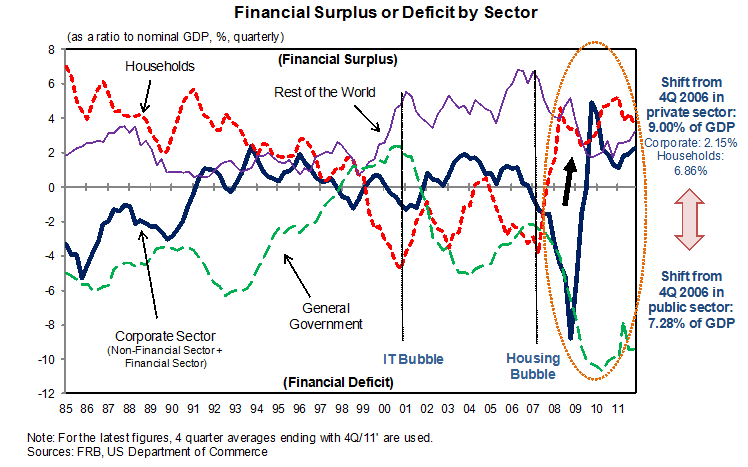
7d) Richard Koo’s and other Sector Balances
A list of long-term sector balances and related provided by Nomura's research institute and its chief economist Richard Koo.
Read More »
Read More »
QE, QEE, the Money Multiplier and the Secular Stagnation Confusion
In some countries, the money multiplier is falling, in some others it is increasing, mostly due to central bank tightening. Does this justify to speak of secular stagnation?
Read More »
Read More »
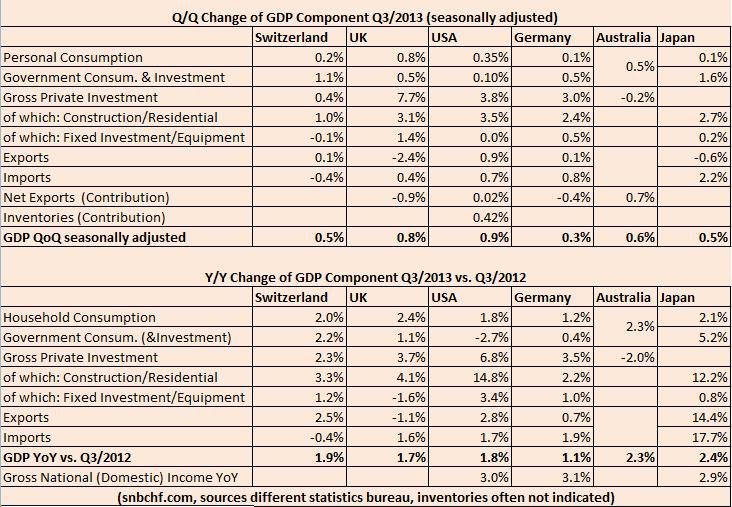
Swiss GDP Details Compared to UK, USA, Germany, Japan and Australia, Q3 2013
The Swiss GDP was again one of the strongest major economies. The quarterly growth rate in the third quarter was 0.5%, the yearly one 1.9%. U.S. GDP improved by 3.6% QoQ annualized. For comparison purposes, our figures are not annualized; hence the equivalent is 0.9% QoQ. In Japan and Switzerland private consumption rose by 0.1% … Continue reading...
Read More »
Read More »
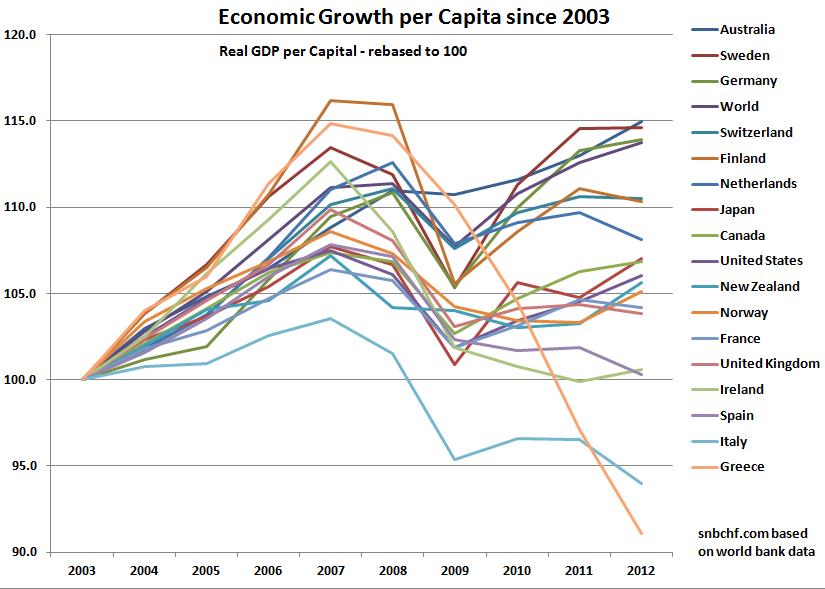
Japan Beats the United States in GDP Growth per Capita for Last Decade
GDP Growth per Capita in Developed Nations in the following order: Australia Sweden Germany Switzerland Netherlands Japan Canada United States France United Kingdom Ireland Spain Italy Greece
Read More »
Read More »
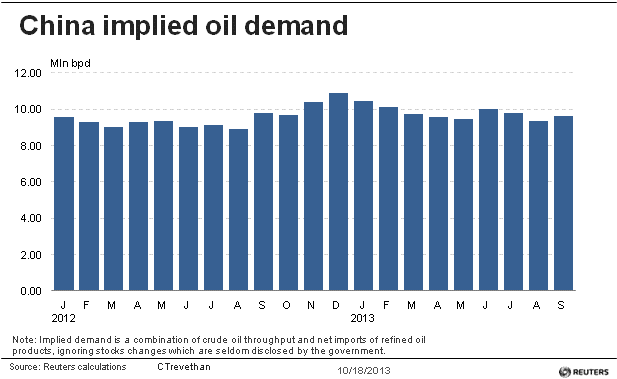
U.S. Energy Independence versus the rise of Chinese household and industrial oil demand
(Originally written in 2012) We maintain that our claim that US energy independent by EIA are misleading. On the contrary, import costs for foreign oil will be the same in 2020 as today
Read More »
Read More »
Global Purchasing Manager Indices
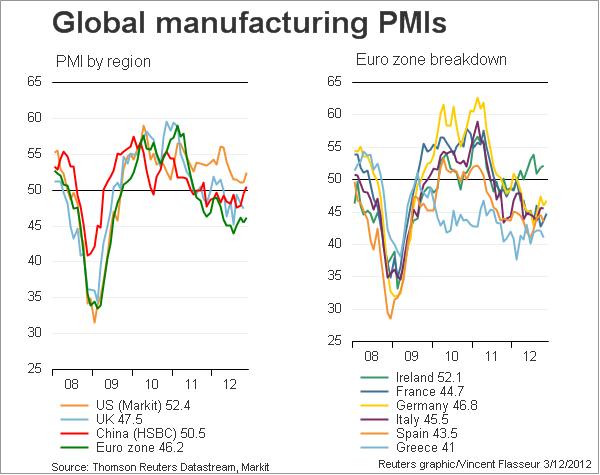
Manufacturing Purchasing Manager Indices (PMIs) are considered to be the leading and most important economic indicators. August 2013 Update Emerging markets: Years of strong increases in wages combined with tapering fears have taken its toll: Higher costs and lower investment capital available. EM Companies have issues in coping with developed economies. Some of them …
Read More »
Read More »
Global Purchasing Manager Indices, Update January 25
Manufacturing PMIs are considered to be the leading and most important economic indicators. After a strong slowing in summer 2012 and the Fed’s QE3, this is the fourth month of improvements in global PMIs January 25th Expansion-contraction ratio: There are 15 countries that show values above 50 and 14 with values under 50. Positive-negative-change ratio: …
Read More »
Read More »
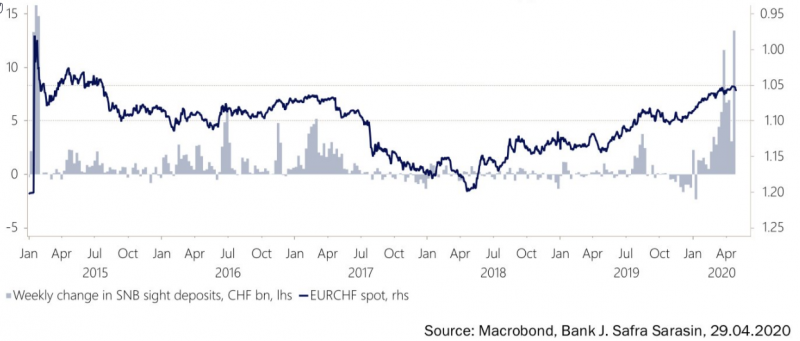
Quantitative Easing, Gold and the Swiss Franc
The main drivers of demand for Swiss francs are the euro crisis, but even more, the behavior of American investors, who go out of the dollar in the fear of further bad US economic data and of Quantitative Easing. This will push down the dollar, and safe-havens like the CHF, gold or the Japanese Yen up. … Continue reading »
Read More »
Read More »
The Biggest Bubble of the Century is Ending: Government Bond Yields
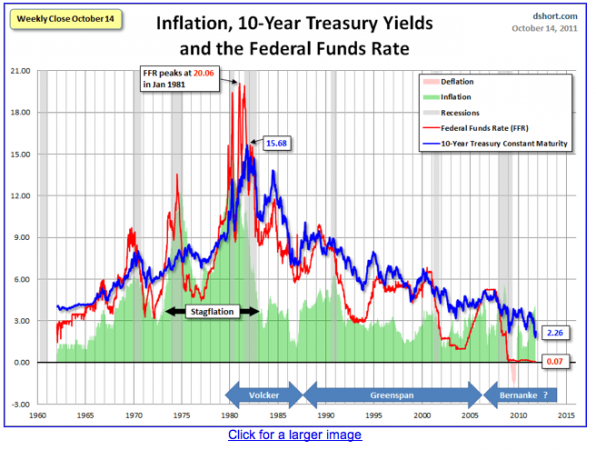
Government bond yields under 10 years for safe-havens are close to zero. In April 2013, even 20 year bond yields are less than 3%, What can explain this bubble of the century? Update August 16, 2013: So, 10-year Treasury yields have ended the day closer to 3 per cent. But not as close as they … Continue reading »
Read More »
Read More »
Global Purchasing Manager Indices, Update December 17
Manufacturing PMIs are considered to be the leading and most important economic indicators. Since the Fed’s QE3, this is the third month of improvements in global PMIs after a strong slowing in summer 2012. January 25th Expansion-contraction ratio: There are as many countries that show values above 50 as under 50. Positive-negative-change ratio: 18 countries …
Read More »
Read More »
Who is the Biggest Debt Time Bomb: Japan, France, the UK or the United States?
Some must reads: According to the Economist the biggest time bomb in the euro zone crisis is France.
We wonder why the United States and Britain, that have same weak trade balances, the same weak competitiveness and a debt overhang, shouldn't have a problem?
Just because France must do austerity according to the German Fiscal Compact wish, and the US and Britain do not need to do this?
Or like Ray Dalio called it, are the US and Britain...
Read More »
Read More »
Can the United States Be Really More than Just the Global Consumer?
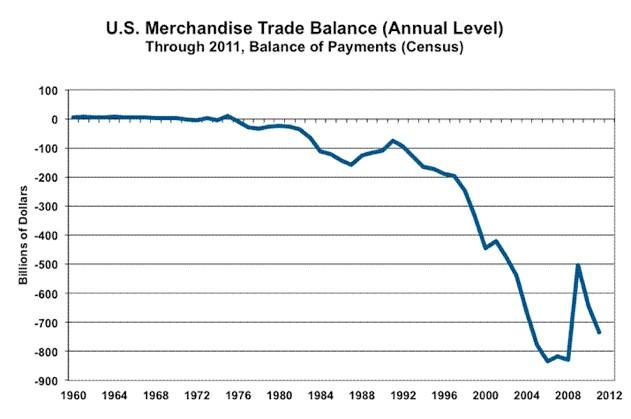
The ISM PMI under 50 shows that the United States are in contraction as for industrial production. The dollar is simply too strong. The Americans consume, but the US trade deficit gets bigger. The Chinese, Japanese, Germans and some global US firms take the profits on it. Today a worth-reading propaganda...
Read More »
Read More »
The Balance Sheet Recession: UK Q2 Housing Equity Injection Largest Since Q2 2011
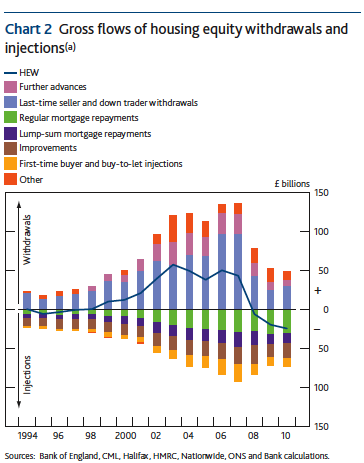
The American-Taiwanese economist Richard Koo, is the chief-economist of the Nomura Research Institute. In his theory of the Balance Sheet Recession he distinguishes between the “Yang” phase of the economy and the “Yin” phase (the so-called “balance sheet recession”). In “Yang” times companies want to increase profit and people consume a big part of their pay …
Read More »
Read More »
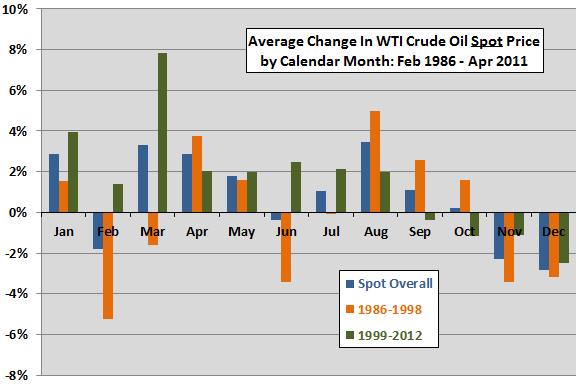
Seasonal Factors on Oil
Evidence from simple tests supports perhaps some belief that crude oil tends to have strong and weak months of the year, Q4 is often the weakest quarter and Q1 and Q2 the best.
Read More »
Read More »
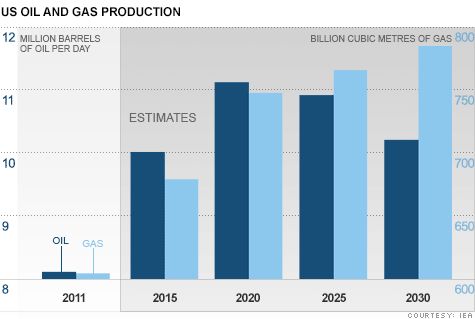
Before getting too excited about the IEA’s forecast of US oil production leadership…
Saxo Bank, recently called for quitting long Gold and "being scared" trades.
For them shale gas & oil is the game changer for the United States. It should make the US the leader for global growth in the next years. The International Energy Association (IEA) declared that the US would be energy-independent by 2030.
Today a nice article...
Read More »
Read More »


