Tag Archive: S&P 500
Affordable Care Act & The Inflation Of Healthcare
When the Obama Administration first suggested the Affordable Care Act following the Financial Crisis, we argued that the outcome would be substantially higher, not lower, healthcare costs. It is interesting today that economists and the media complain about surging healthcare costs with each inflation report but fail to identify the root cause of that escalation. …
Read More »
Read More »
Prediction For 2025 Using Valuation Levels
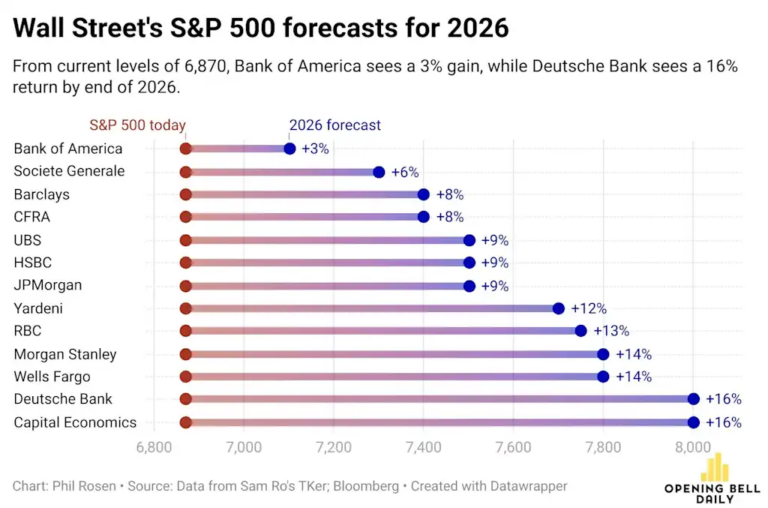
It’s that time of year when Wall Street polishes up its crystal balls and predicts next year's market returns. Since Wall Street never predicts a down year, these forecasts are often wrong and sometimes very wrong. For example, on December 7th, 2021, we wrote an article about the predictions for 2022. “There is one thing …
Read More »
Read More »
Permabull? Hardly.
I never thought someone would label me a "Permabull." This is particularly true of the numerous articles I wrote over the years about the risks of excess valuations, monetary interventions, and artificially suppressed interest rates. However, here we are. "Lance, you are just another permabull talking your book. When this market crashes you will still be telling …
Read More »
Read More »
Economic Indicators And The Trajectory Of Earnings
Understanding the trajectory of corporate earnings is crucial for investors, as these earnings significantly influence stock valuations and market performance. Economic indicators such as Gross Domestic Product (GDP), the Institute for Supply Management (ISM) Manufacturing Index, and the Chicago Fed National Activity Index (CFNAI) provide valuable insights into the economic environment that shapes company profitability. …
Read More »
Read More »
Portfolio Rebalancing And Valuations. Two Risks We Are Watching.
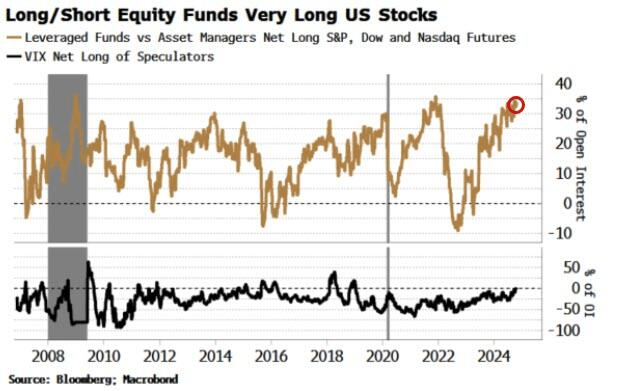
While analysts are currently very optimistic about the market, the combined risk of high valuations and the need to rebalance portfolios in the short term may pose an unanticipated threat. This is particularly the case given the current high degree of speculation and leverage in the market.
Read More »
Read More »
The Kalecki Profit Equation And The Coming Reversion
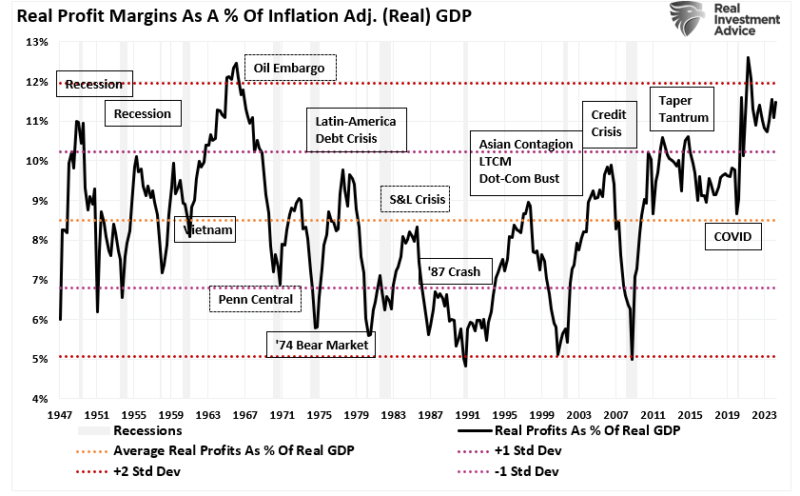
Corporations are currently producing the highest level of profitability, as a percentage of GDP, in history. However, understanding corporate profitability involves more than glancing at quarterly earnings reports. At its core, the Kalecki Profit Equation provides a valuable framework, especially when exploring the reasons behind today’s elevated profit margins and what could disrupt them. James …
Read More »
Read More »
Leverage And Speculation Are At Extremes
Financial markets often move in cycles where enthusiasm drives prices higher, sometimes far beyond what fundamentals justify. As discussed in last week's #BullBearReport, leverage and speculation are at the heart of many such cycles. These two powerful forces support the amplification of gains during upswings but can accelerate losses in downturns. Today’s market environment shows …
Read More »
Read More »
Credit Spreads: The Markets Early Warning Indicators
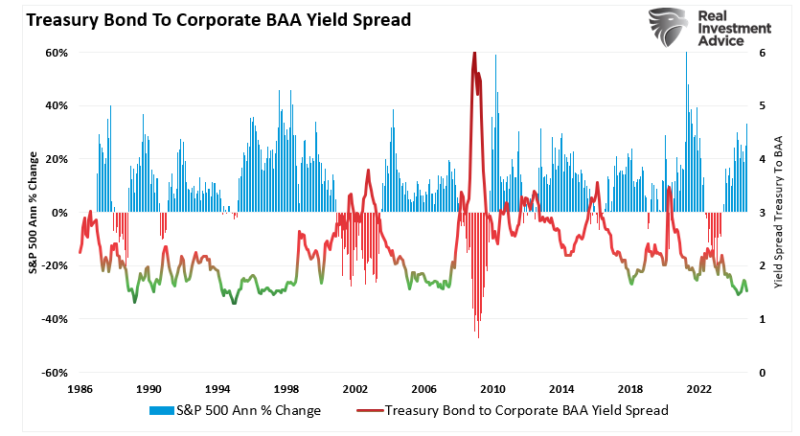
Credit spreads are critical to understanding market sentiment and predicting potential stock market downturns. A credit spread refers to the difference in yield between two bonds of similar maturity but different credit quality. This comparison often involves Treasury bonds (considered risk-free) and corporate bonds (which carry default risk). By observing these spreads, investors can gauge …
Read More »
Read More »
“Trumpflation” Risks Likely Overstated
With the re-election of President Donald Trump, the worries about tariffs and pro-business policies sparked concerns of "Trumpflation." Inflation has been a top concern for policymakers, businesses, and everyday consumers, especially following the sharp price increases experienced over the past few years. However, growing evidence shows inflationary pressures continue to ease significantly, paving the way …
Read More »
Read More »
Yardeni And The Long History Of Prediction Problems
Following President Trump's re-election, the S&P 500 has seen an impressive surge, climbing past 6,000 and sparking significant optimism in the financial markets. Unsurprisingly, the rush by perma-bulls to make long-term predictions is remarkable.
Read More »
Read More »
Paul Tudor Jones: I Won’t Own Fixed Income
Paul Tudor Jones recently voiced concerns that rising U.S. deficits and debt and increasing interest rates could lead to a fiscal crisis. His perspective reflects the long-standing fear that sustained borrowing will trigger inflation, raise interest rates, and eventually overwhelm the government’s ability to manage its debt obligations. In short, his thesis is that interest …
Read More »
Read More »
Exuberance – Investors Have Rarely Been So Optimistic
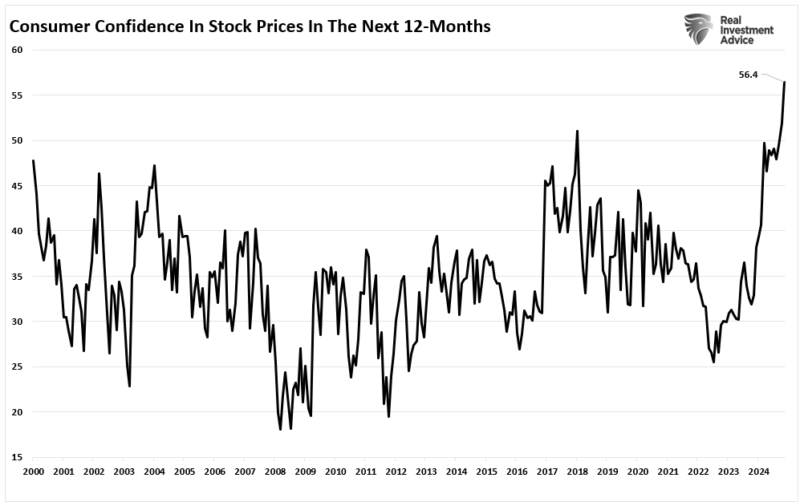
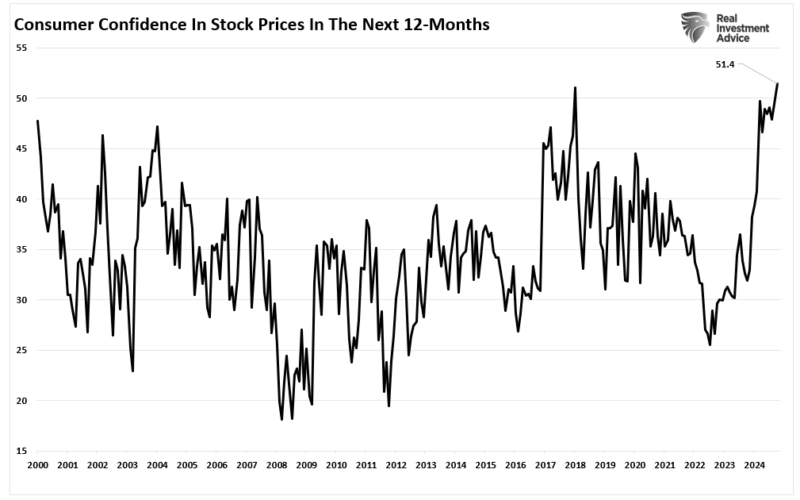
Investor exuberance has rarely been so optimistic. In a recent post, we discussed investor expectations of returns over the next year, according to the Conference Board's Sentiment Index. To wit: "Consumer confidence in higher stock prices in the next year remains at the highest since 2018, following the 2017 “Trump” tax cuts." (Note: this survey was …
Read More »
Read More »
Exuberance – Investors Have Rarely Been So Optimistic
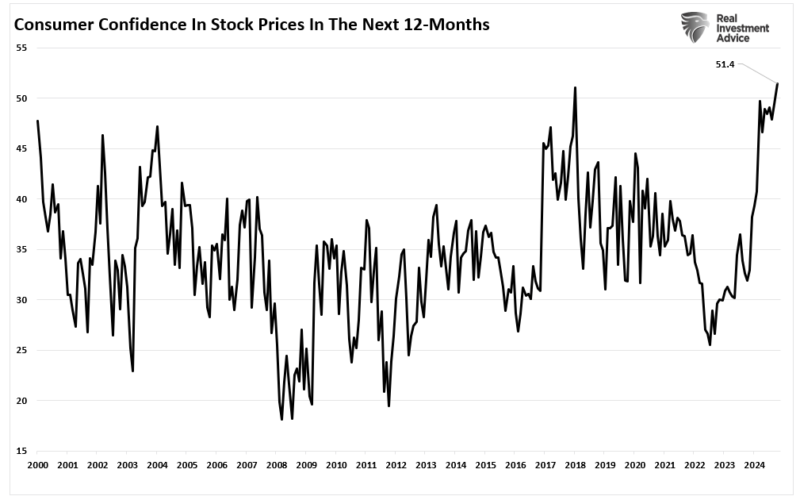
Investor exuberance has rarely been so optimistic. In a recent post, we discussed investor expectations of returns over the next year, according to the Conference Board’s Sentiment Index. To wit:
“Consumer confidence in higher stock prices in the next year remains at the highest since 2018, following the 2017 “Trump” tax cuts.“ (Note: this survey was completed before the Presidential Election.)
We also discussed households’ allocations...
Read More »
Read More »
Trump Presidency – Quick Thoughts On Market Impact
The prospect of a Trump presidency has led to much debate and speculation about how markets might react. Depending on what policies are eventually passed, there are potential risks and opportunities in both the stock and bond markets. While the market surged immediately following the election, many potential future headwinds may impact returns from economic …
Read More »
Read More »
Trump Presidency – Quick Thoughts On Market Impact
The prospect of a Trump presidency has led to much debate and speculation about how markets might react. Depending on what policies are eventually passed, there are potential risks and opportunities in both the stock and bond markets. While the market surged immediately following the election, many potential future headwinds may impact returns from economic growth, monetary and fiscal policy, and geopolitical events.
Here are some quick...
Read More »
Read More »
Election Day! Plan For Volatility
With Election Day finally here, markets are bracing for potential volatility. History shows that the stock market can react unpredictably to election outcomes, especially when the results are unclear or contested. In past elections, sudden policy shifts, political uncertainty, or contentious outcomes caused heightened volatility—making it essential to prepare your portfolio now to weather whatever …
Read More »
Read More »
Election Day! Plan For Volatility
With Election Day finally here, markets are bracing for potential volatility. History shows that the stock market can react unpredictably to election outcomes, especially when the results are unclear or contested. In past elections, sudden policy shifts, political uncertainty, or contentious outcomes caused heightened volatility—making it essential to prepare your portfolio now to weather whatever the day brings.
The S&P 500 has averaged a...
Read More »
Read More »
Corporate Buybacks: A Wolf In Sheep’s Clothing
Corporate buybacks have become a hot topic, drawing criticism from regulators and policymakers. In recent years, Washington, D.C., has considered proposals to tax or limit them. Historically, buybacks were banned as a form of market manipulation, but in 1982, the SEC legalized open-market repurchases through Rule 10b-18. Although intended to offer companies flexibility in managing …
Read More »
Read More »
Corporate Buybacks: A Wolf In Sheep’s Clothing
Corporate buybacks have become a hot topic, drawing criticism from regulators and policymakers. In recent years, Washington, D.C., has considered proposals to tax or limit them. Historically, buybacks were banned as a form of market manipulation, but in 1982, the SEC legalized open-market repurchases through Rule 10b-18. Although intended to offer companies flexibility in managing capital, buybacks have evolved into tools often serving executive...
Read More »
Read More »
Key Market Indicators for November 2024
Key market indicators for November 2024 present a complex but opportunity-filled environment for traders and investors. Following the first phase of Federal Reserve rate cuts and growing global uncertainties, the technical landscape suggests several notable shifts. Let’s explore the key market indicators to watch.
Note: If you are unfamiliar with basic technical analysis, this video is a short tutorial.
Seasonality and Breakout...
Read More »
Read More »


