


Read More »


 On Swiss National Bank
  Main SNB Background Info


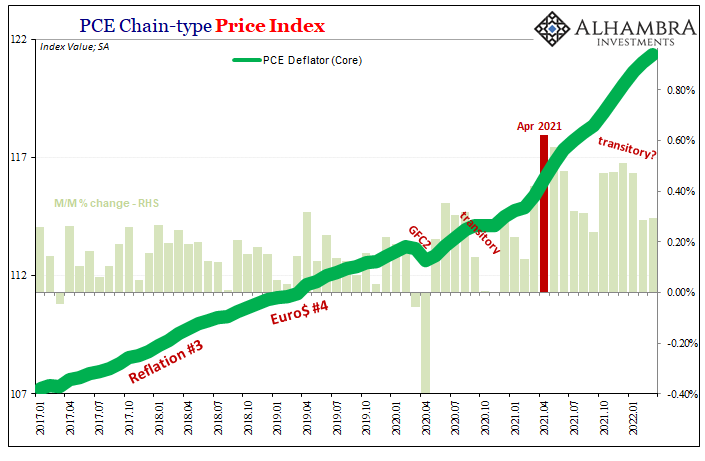
 Some ‘Core’ ‘Inflation’ Difference(s)
6 May 2022
Is It Recession?30 Apr 2022
The Short, Sweet Income Case For Ugly Inversion(s), Too4 Apr 2022
White-Hot Cycles of Silence28 Dec 2021
Trying To Project The Goods Trade Cycle17 Dec 2021
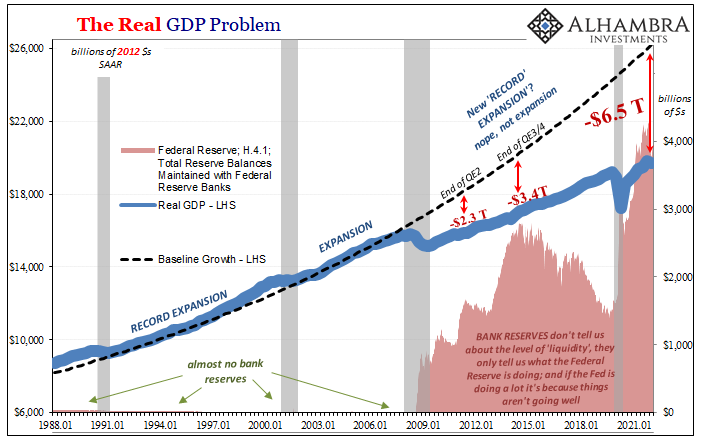
GDP Red Flag31 Oct 2021
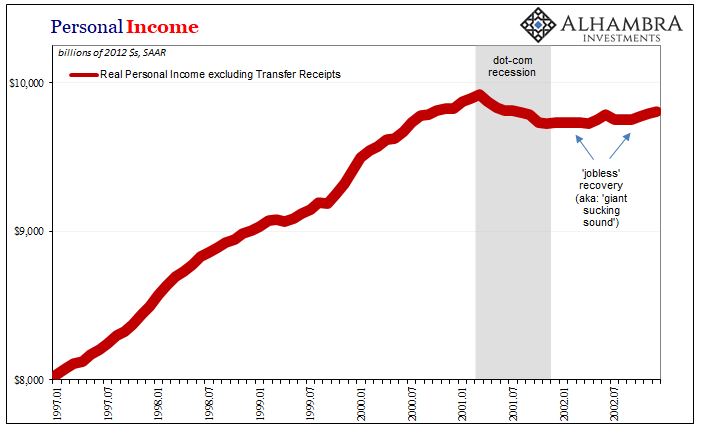
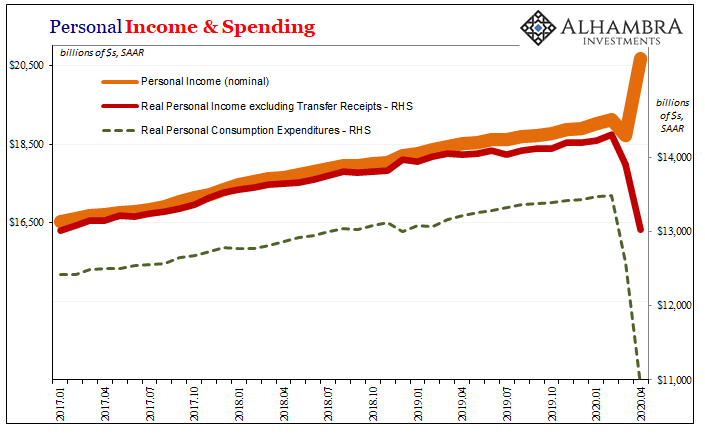
Personal Income and Spending: The Other Side1 Jun 2020
GDP + GFC = Fragile1 May 2020
Three Straight Quarters of 2 percent, And Yet Each One Very Different2 Feb 2020
Three (Rate Cuts) And GDP, Where (How) Does It End?1 Nov 2019
Bi-Weekly Economic Review: Investing Is Not A Game of Perfect11 Apr 2018
Can’t Hide From The CPI19 Nov 2017
The (Economic) Difference Between Stocks and Bonds4 Nov 2017
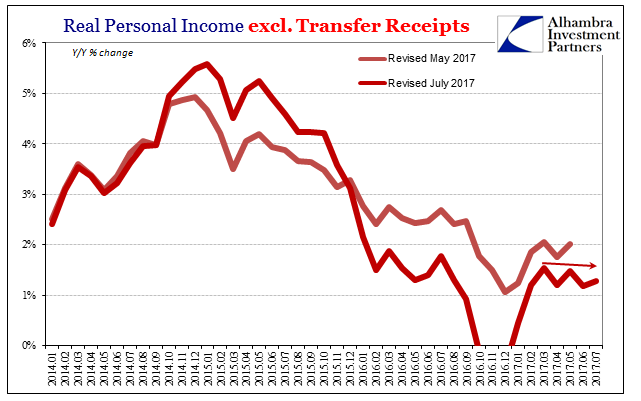
Incomes Are What Matters, So Bad Month, Bad Year, Bad Decade8 Oct 2017
Proving Q2 GDP The Anomaly, Incomes Yet Again Fail To Accelerate5 Sep 2017
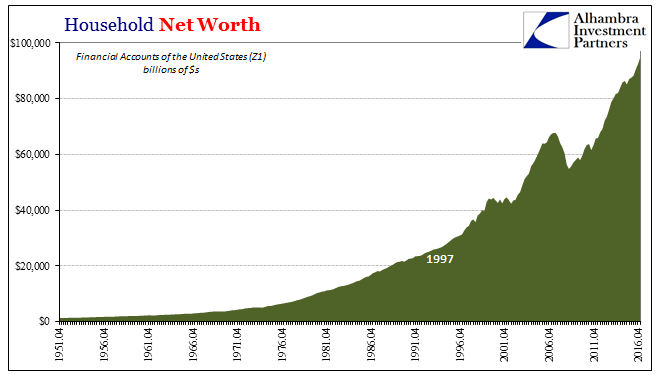
Wealth Paradox Not Effect18 Jun 2017
Real Disposable Income: Headwinds of the Negative3 Mar 2017
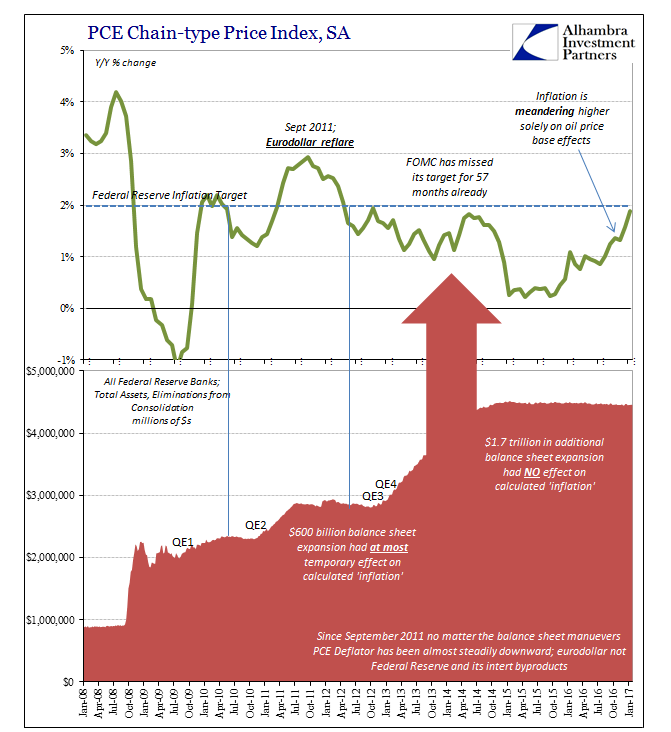
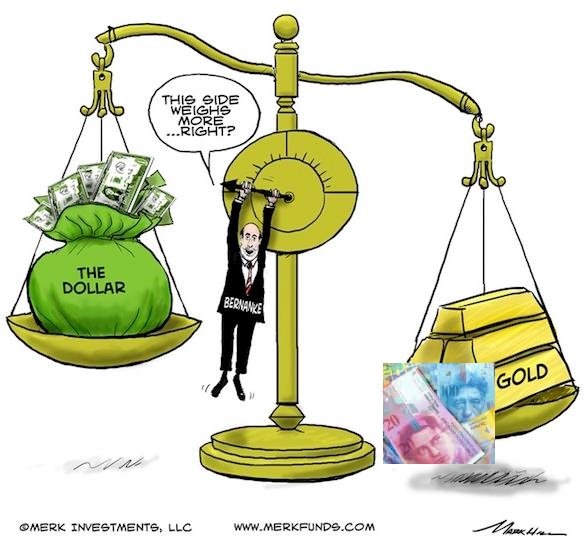
Quantitative Easing, Gold and the Swiss Franc27 Dec 2012
