Tag Archive: oil prices
Now Back To Our Regularly Scheduled Economy
The clock really was ticking on this so-called economic boom. A product in many economic accounts of Keynesian-type fantasy, the destructive effects of last year’s hurricanes in sharp contrast to this year’s (which haven’t yet registered a direct hit on a major metropolitan area or areas, as was the case with Harvey and Irma) meant both a temporary rebound birthed by rebuilding as well as an expiration date for those efforts.
Read More »
Read More »
Downslope CPI
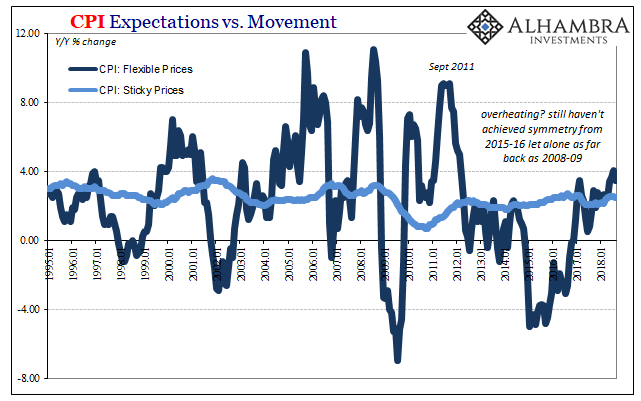
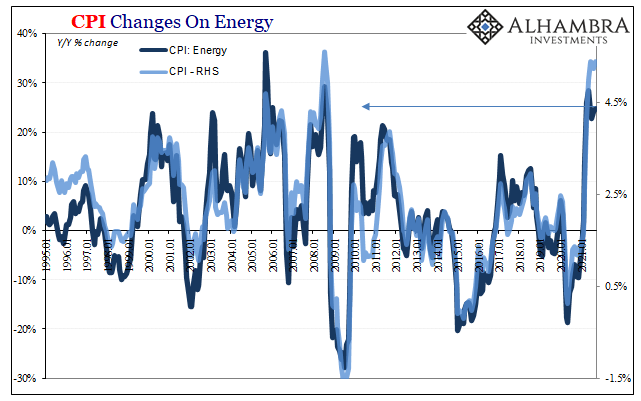
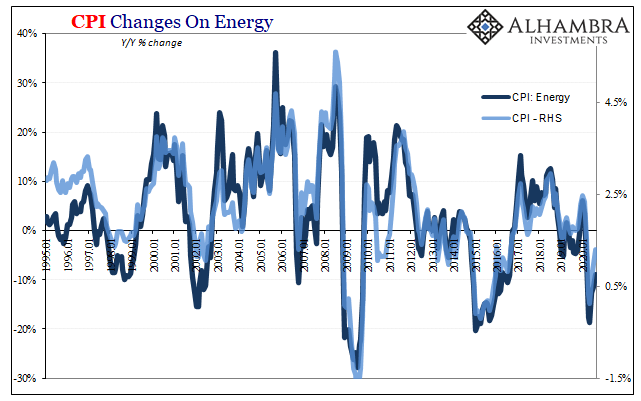
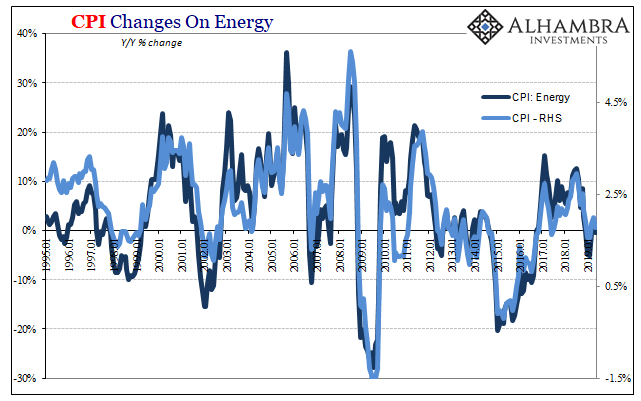
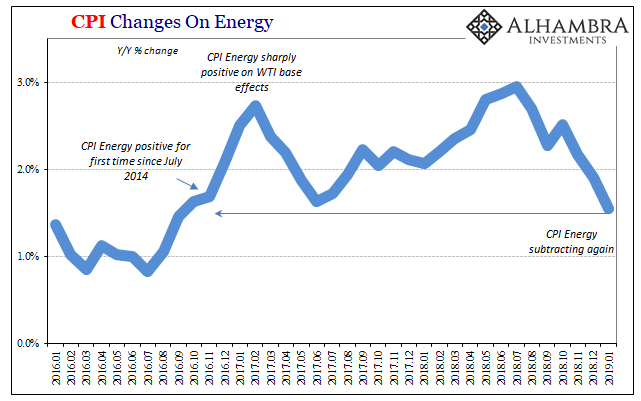
Cushing, OK, delivered what it could for the CPI. The contribution to the inflation rate from oil prices was again substantial in August 2018. The energy component of the index gained 10.3% year-over-year, compared to 11.9% in July. It was the fourth straight month of double digit gains.
Read More »
Read More »
What’s Hot Isn’t Retail Sales Growth
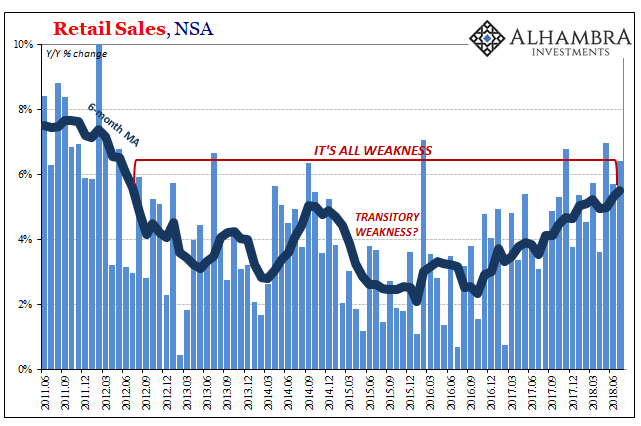
Americans are spending more on filling up. A lot more. According the Census Bureau, retail sales at gasoline stations had increased by nearly 20% year-over-year (unadjusted) in both May and June 2018. In the latest figures for July, released today, gasoline station sales were up by more than 21%.
Read More »
Read More »
Bi-Weekly Economic Review
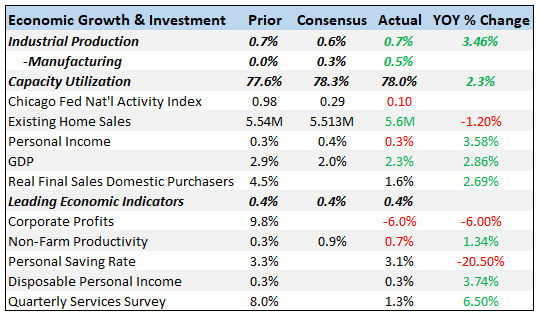
This will be a fairly quick update as I just posted a Mid-Year Review yesterday that covers a lot of the same ground. There were, as you’ll see below, some fairly positive reports since the last update but the markets are not responding to the better data. Markets seem to be more focused on the trade wars and the potential fallout. I would also note that at least some of the recent strength in the data is related to the tariffs.
Read More »
Read More »
Bi-Weekly Economic Review: Growth Expectations Break Out?
There are a lot of reasons why interest rates may have risen recently. The federal government is expected to post a larger deficit this year – and in future years – due to the tax cuts. Further exacerbating those concerns is the ongoing shrinkage of the Fed’s balance sheet. Increased supply and potentially decreased demand is not a recipe for higher prices. In addition, there is some fear that the ongoing trade disputes may impact foreign demand...
Read More »
Read More »
Bi-Weekly Economic Review: Oil, Interest Rates & Economic Growth
The yield on the 10 year Treasury note briefly surpassed the supposedly important 3% barrier and then….nothing. So, maybe, contrary to all the commentary that placed such importance on that level, it was just another line on a chart and the bond bear market fear mongering told us a lot about the commentators and not a lot about the market or the economy.
Read More »
Read More »
Durable and Capital Goods, Distortions Big And Small
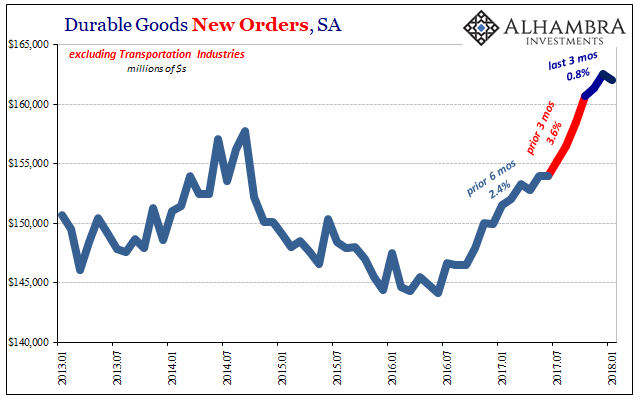
New orders for durable goods, excluding transportation industries, rose 9.1% year-over-year (NSA) in January 2018. Shipments of the same were up 8.8%. These rates are in line with the acceleration that began in October 2017 coincident to the aftermath of hurricanes Harvey and Irma. In that way, they are somewhat misleading.
Read More »
Read More »
The Conspicuous Rush To Import
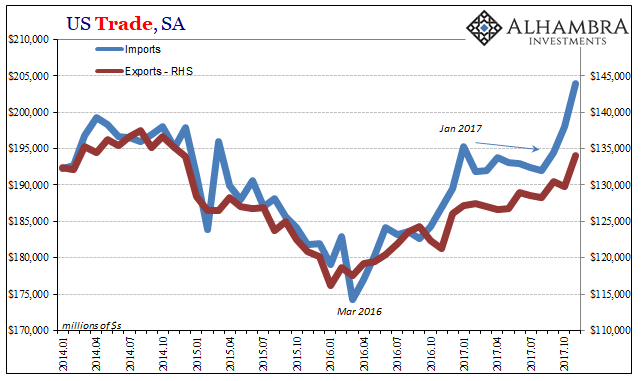
According to the Census Bureau, US companies have been importing foreign goods at a relentless pace. In estimates released last week, seasonally-adjusted US imports jumped to $204 billion in November 2017. That’s a record high finally surpassing the $200 billion mark for the first time, as well as the peaks for both 2014 and 2007.
Read More »
Read More »
Reduced Trade Terms Salute The Flattened Curve
The Census Bureau reported earlier today that US imports of foreign goods jumped 9.9% year-over-year in October. That is the second largest increase since February 2012, just less than the 12% import growth recorded for January earlier this year.
Read More »
Read More »
Globally Synchronized Downside Risks
Oil prices were riding high after several weeks of steady, significant gains. It’s never really clear what it is that might actually move markets in the short run, whether for crude it was Saudi Arabia’s escalating activities or other geopolitical concerns. Behind those, the idea of “globally synchronized growth” that is supposedly occurring for the first time since before the Great “Recession” while it may not have pushed oil investors to buy...
Read More »
Read More »
Non-Transitory Meandering
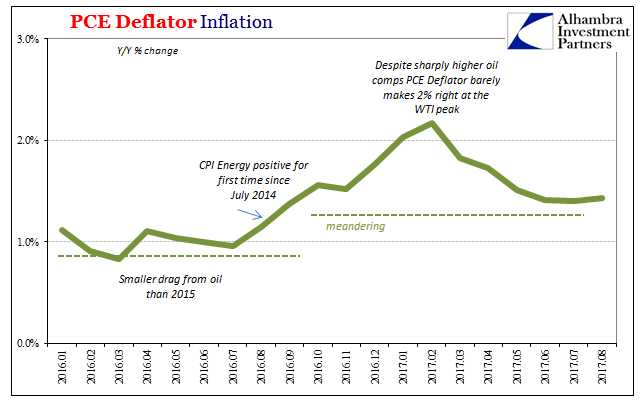
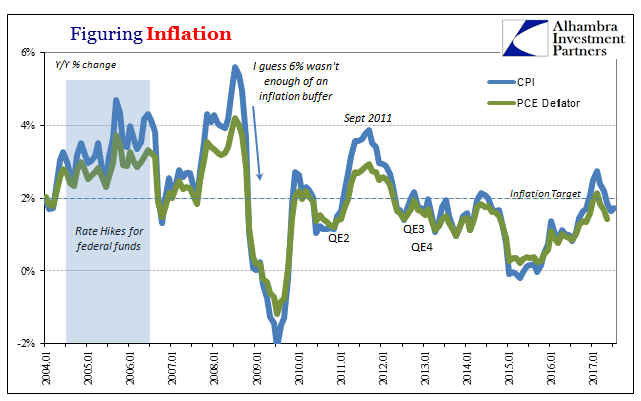
Monetary officials continue to maintain that inflation will eventually meet their 2% target on a sustained basis. They have no other choice, really, because in a monetary regime of rational expectations for it not to happen would require a radical overhaul of several core theories. Outside of just the two months earlier this year, the PCE Deflator has missed in 62 of the past 64 months. The FOMC is simply running out of time and excuses.
Read More »
Read More »
Harvey’s Muted (Price) Impact On Oil
The impact of Hurricane Harvey on the Gulf energy region is becoming clear. There have been no surprises to date, even though the storm did considerable damage and shuttered or disrupted significant capacity. Most of that related to gasoline, which Americans have been feeling in pump prices.
Read More »
Read More »
COT Report: Black (Crude) and Blue (UST’s)
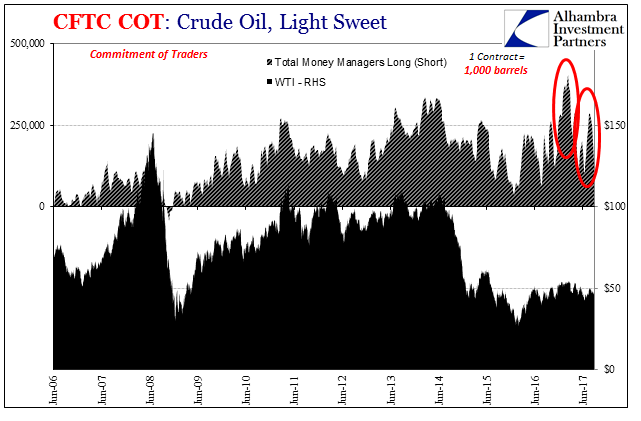
Over the past month, crude prices have been pinned in a range $50 to the high side and ~$46 at the low. In the futures market, the price of crude is usually set by the money managers (how net long they shift). As discussed before, there have been notable exceptions to this paradigm including some big ones this year.
Read More »
Read More »
Oil Prices, CPI: Why Not Zero?
In the early throes of economic devastation in 1931, Sweden found itself particularly vulnerable to any number of destabilizing factors. The global economy had been hit by depression, and the Great Contraction was bearing down on the Swedish monetary system. The krona had always been linked to the British pound, so that when the Bank of England removed gold convertibility (left the gold standard) from its notes on September 19 that year the Swedish...
Read More »
Read More »
U.S. Consumer Price Index, Oil Prices: Why It Will Continue, Again Continued
Part of “reflation” was always going to be banks making more money in money. These days that is called FICC – Fixed Income, Currency, Commodities. There’s a bunch of activities included in that mix, but it’s mostly derivative trading books forming the backbone of math-as-money money. The better the revenue conditions in FICC, the more likely banks are going to want to do more of it, perhaps to the point of reversing what is just one quarter shy of...
Read More »
Read More »
Oil Prices and Manufacturing PMI: No Backing Sentiment
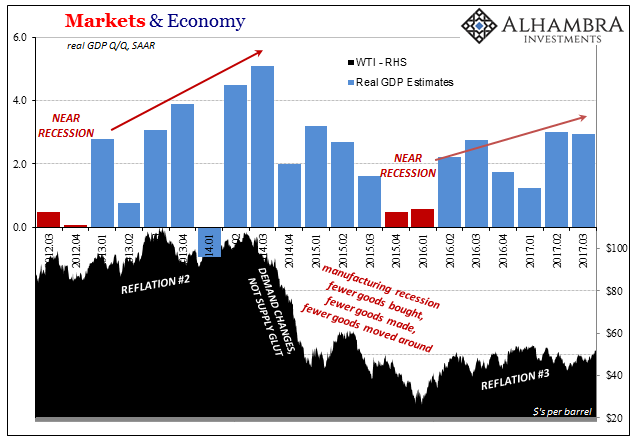
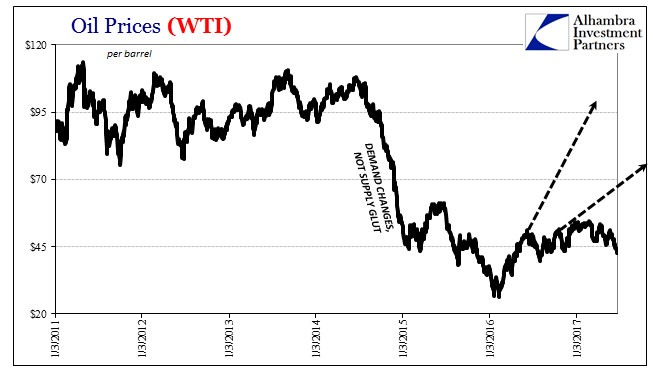
When the price of oil first collapsed at the end of 2014, it was characterized widely as a “supply glut.” It wasn’t something to be concerned about because it was believed attributable to success, and American success no less. Lower oil prices would be another benefit to consumers on top of the “best jobs market in decades.”
Read More »
Read More »
Fading Further and Further Back Toward 2016
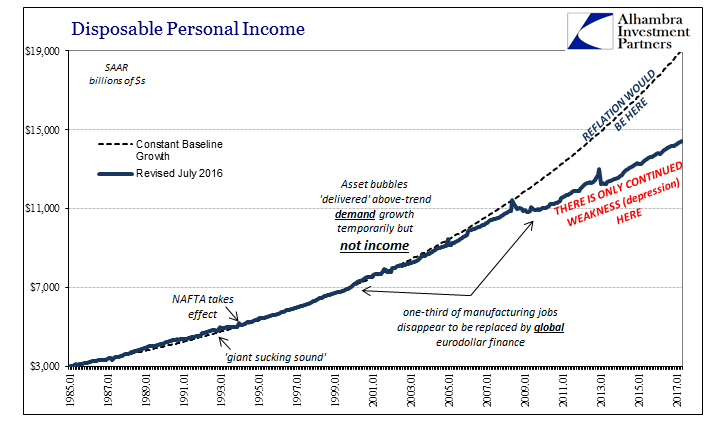
Earlier this month, the BEA estimated that Disposable Personal Income in the US was $14.4 trillion (SAAR) for April 2017. If the unemployment rate were truly 4.3% as the BLS says, there is no way DPI would be anywhere near to that low level. It would instead total closer to the pre-crisis baseline which in April would have been $19.0 trillion. Even if we factor retiring Baby Boomers in a realistic manner, say $18 trillion instead, what does the...
Read More »
Read More »
American Expectations, Chinese Prices
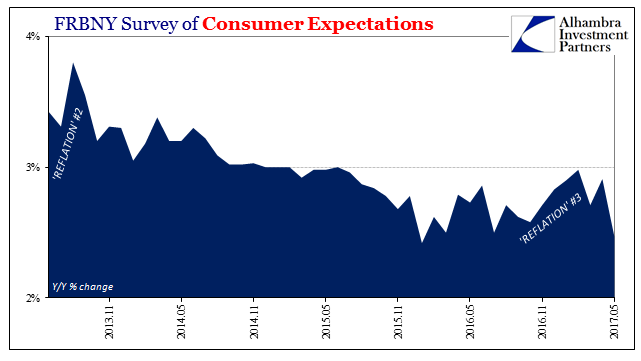
The Federal Reserve Bank of New York has for the past almost four years conducted its own assessment of consumer expectations.Though there are several other well-known consumer surveys, FRBNY adding another could be helpful for corroborating them. Unfortunately for the Fed, it has.
Read More »
Read More »
All About Inventory
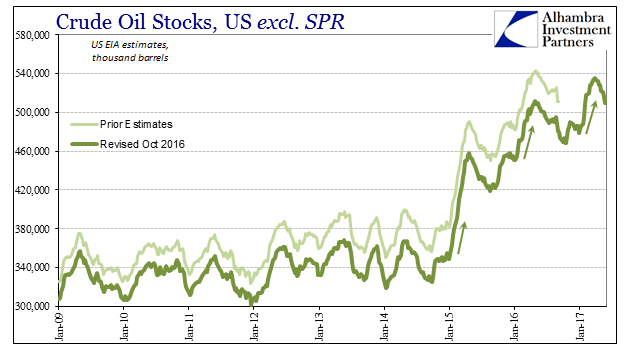
Andy Hall has been called the God of Oil. As chief of Astenbeck Capital, he has proven at times that even gods can be mortal. In the “rising dollar” period, for example, after making money on the way down Mr. Hall went bullish.
Read More »
Read More »
Dollars And Sent(iment)s
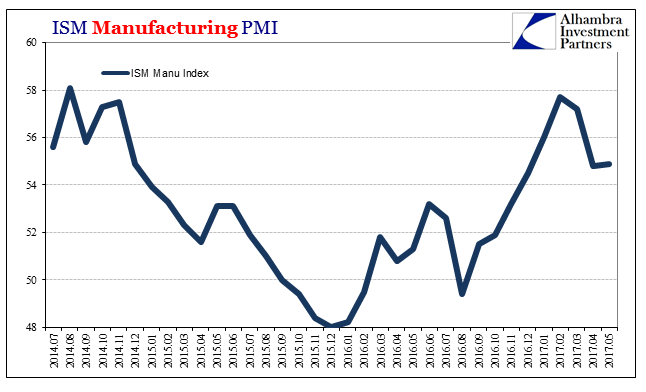
Both US manufacturing PMI’s underwhelmed just as those from China did. The IHS Markit Index was lower than the flash reading and the lowest level since last September. For May 2017, it registered 52.7, down from 52.8 in April and a high of 55.0 in January. Just by description alone you can appreciate exactly what pattern that fits. The ISM Manufacturing PMI was slightly higher in May than April, 54.9 versus 54.8, but still down from a February peak...
Read More »
Read More »


