Found 151 search results for keyword: label/Great Graphic
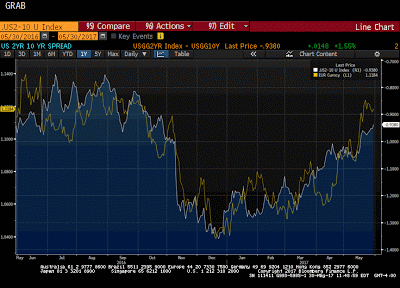
Great Graphic: US Rate Curve and the Euro
This Great Graphic was created on Bloomberg. It shows two times series. The yellow line and the left-hand scale show the euro's exchange rate against the dollar for the past year. The white line depicts the spread between the US two-year and 10-year yield.
Read More »
Read More »
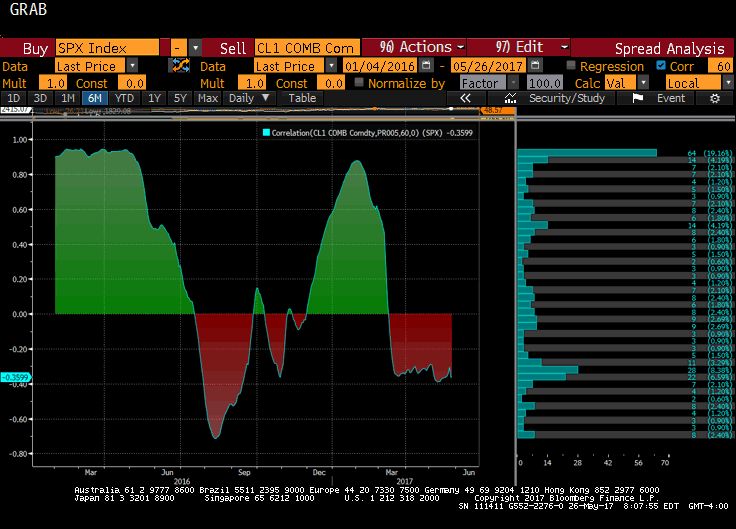
Great Graphic: OIl and the S&P 500
The fluctuation of oil prices is often cited as an important factor driving equities. Our work shows that this is not always the case and that the correlation between the price of oil and the S&P 500 continues to ease.
Read More »
Read More »
Great Graphic: Trade-Weighted Dollar
US TWI has appreciated a little since the end of Q1. The euro and sterling's strength are exceptions to the rule. The dollar has edged up against the currencies of the US top four trading partners here in Q2.
Read More »
Read More »
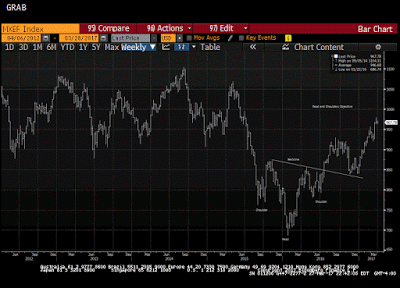
Great Graphic: Emerging Market Stocks
MSCI Emerging Market Index is up 12.25% here in Q1. The index is approaching long-standing technical objectives. Look for profit-taking ahead of quarter-end as fund managers rebalance.
Read More »
Read More »
Great Graphic: French Premium over Germany Continues to Grow
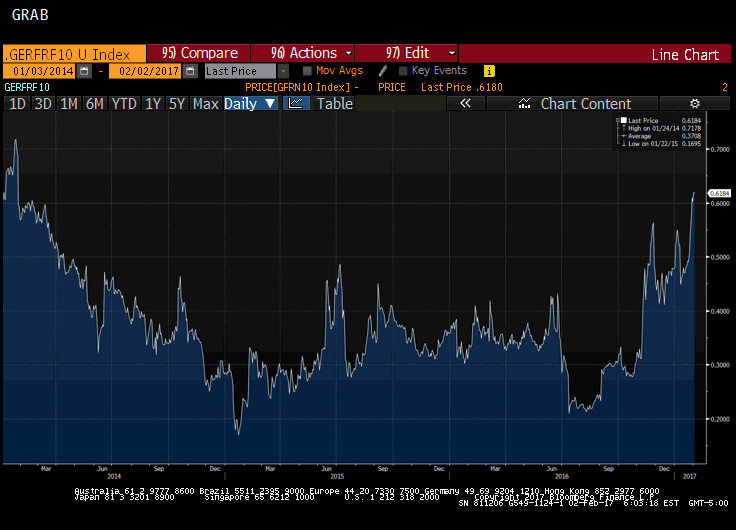
European premiums over Germany typically increase in a rising interest rate environment. France's premium is at the most in two years. France is still set to turn back the challenge from Le Pen.
Read More »
Read More »
Great Graphic: Mexico and China Unit Labor Costs
Mexico has been gaining competitiveness over China before last year's depreciation of the peso. The depreciation of the peso, and other US actions can contribute to the destabilization of Mexico. An economically prosperous and stable Mexico has long been understood to be in the US interest.
Read More »
Read More »
Great Graphic: Real Rates in US are Elevated
The US 10-year yield fell briefly below 1.32% last July. The yield slowly rose to reach 1.80% in mid-October. The day after the election, the yield initially slipped to almost 1.71%. This was a bit of a miscue, and the yield rose sharply to hit almost 2.64% the day after the FOMC hiked rates for the second time in the cycle on December 14. The yield backed off to hit 2.33% at the end of last week.
Read More »
Read More »
Great Graphic: Real Wages
This Great Graphic caught my eye. It was tweeted by Ninja Economics. Her point was about immigration. German had much higher immigration than the UK, but also saw real wage increase of nearly 14% in the 2007-2015 period, while real wages in the UK fell nearly 10.5%.
Read More »
Read More »
Great Graphic: Another Look at the Reproduction Problem
In order for a society to be sustained social relations have to be reproduced. Yet now neither the middle class nor capital are able to reproduce themselves. This may be the single greatest challenge our society faces.
Read More »
Read More »
Great Graphic: Dollar Index Update
The Dollar Index's technical tone has deteriorated. It is corresponding to the easing of US rates and a narrowing differential. The risk is that the correction can continue in the coming days.
Read More »
Read More »
Great Graphic: Yen and Yuan Connection
The US dollar has rallied against both the Japanese yen and Chinese yuan since the end of September. Through today, the yen has fallen 9.8% and the yuan has fallen by 3.5%. What they have in common is the rise in US interest rates relative to their own. Since September 30, the US 10-year yield has from below 1.60% to above 2.40% at the end of last week. Japan's 10-year yield has risen from minus nine basis points at the end of September to five...
Read More »
Read More »
Great Graphic: Euro-the Big Picture
Most economists are focusing on either US monetary policy or US fiscal policy. We focus on the policy mix. After the policy mix, politics is also a weigh on the euro. Our long-term call is for the euro to revisit the lows from 2000.
Read More »
Read More »
Great Graphic: Growth in Federal Spending
Federal spending growth under Obama is lower than under the previous four presidents. Subsequent to the chart, US federal spending has increased. It will likely increase more under the next President.
Read More »
Read More »
Great Graphic: Shifting Trade-Weighted Exchange Rates
The dollar's trade-weighted index is firming and a couple percentage points from the year's high set in January. The yen's trade-weighted index is at several month lows, but remains dramatically higher ear-to-date. The euro's trade-weighted index has begun falling amid concerns that it is the next focus for the anti-globalization/nationalism movement. Sterling's trade-weighted index is extending its recovery as a softer Brexit is anticipated, the...
Read More »
Read More »
Great Graphic: Sentix Shows a Shift
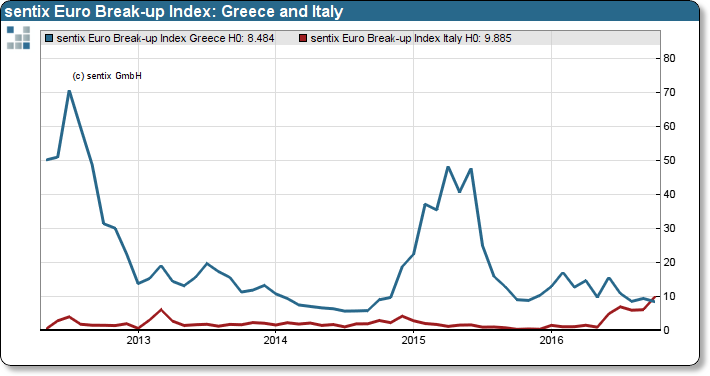
The risk that the eurozone implodes over the next year has risen, but is still modest. Italy has surpassed Greece as the most likely candidate. The December referendum is the second part of Renzi's political reforms.
Read More »
Read More »
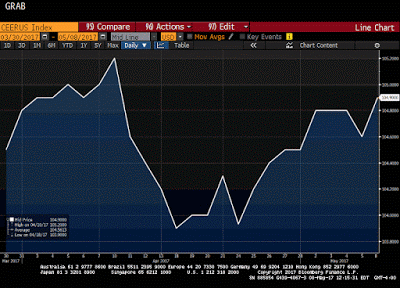
Great Graphic: CRB Index Revisited
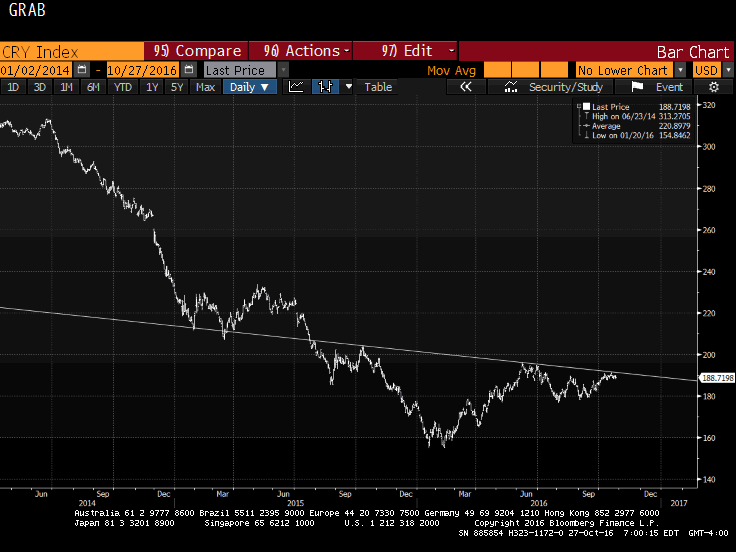
Interest rates and 10-year break-evens are rising. Some think the CRB Index is tracing out a head and shoulders bottom. We look for inflation in non-tradable goods' prices (think services).
Read More »
Read More »
Great Graphic: Italian Banks and a German Bank
DB and Italian bank stocks have been moving in tandem. They suffer from fundamentally different problems. The euro has been selling off as the bank shares rebound.
Read More »
Read More »
Great Graphic: Consumer Inflation: US, UK, EMU
Price pressures appear to have bottomed for the US, UK, and to a lesser extent, EMU. Rise in prices cannot be reduced solely to the increase of oil. Core prices are also rising.
Read More »
Read More »
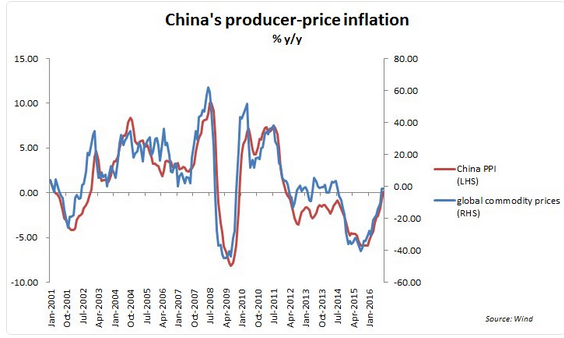
Great Graphic: China’s PPI and Commodities
China's PPI rose for the first time in four years. It is related to the rise in commodities. Yet there are good reasons there is not a perfect fit between China's PPI and commodity prices. US and UK CPI to be reported next week, risk is on the upside.
Read More »
Read More »
Great Graphic: Euro is Approaching Year-Long Uptrend
The year-long euro uptrend comes in near $1.1035, just below the August lows. The technical are fragile, but the euro is below its lower Bollinger Band. The fundamental driver seems to be the backing up of US rates, and widening premium over Germany.
Read More »
Read More »


