|
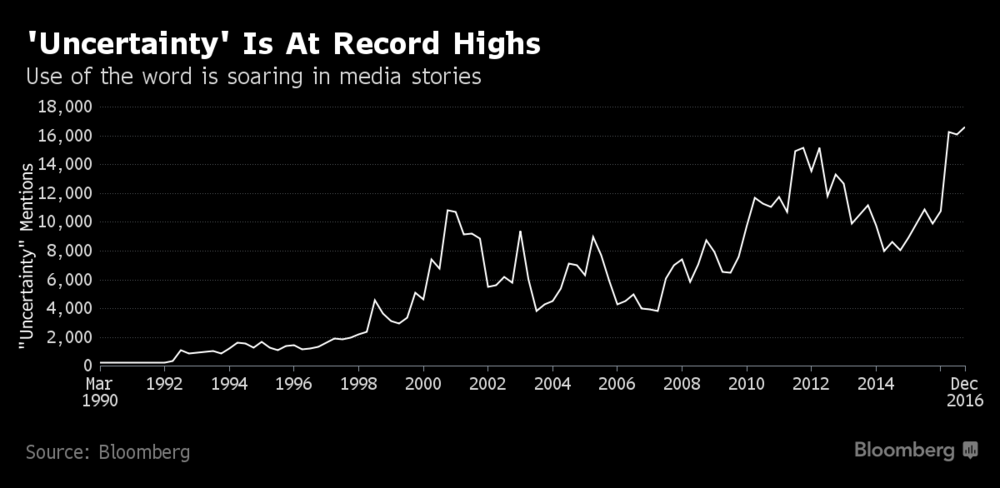
Uncertainty Is At Record Highs 1990 - 2016 |
| Bloomberg have done an excellent article replete with five must see charts including gold charts that suggest that we are on the verge of significant market volatility and turmoil.
From Bloomberg: “A former TV star as U.S. president doesn’t seem to have injected markets with much of a ‘‘fear factor.’’ But digging beneath the surface of an eight-year bull run exposes subtle signs that hint at an uneasy optimism. |
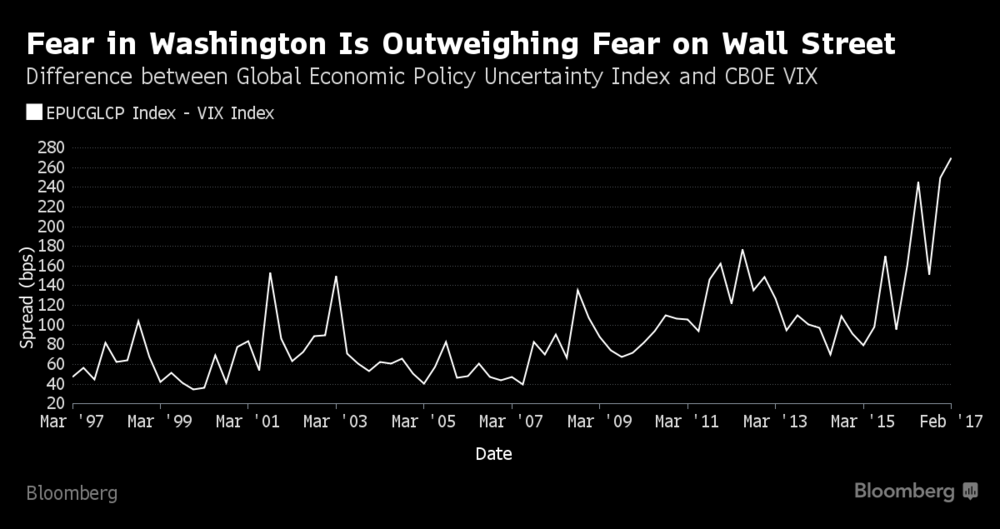
Global Economic Policy Uncertainty Index and CBOE VIX 1997 - 2017 |
| The Dow Jones Industrial Average has sailed past 20,000 and the S&P 500 is nearing its life-time high set in January, indicating that investors have so far shrugged off the uncertainty brought by the new administration.
Here are five charts that suggest all is not well in markets:” |
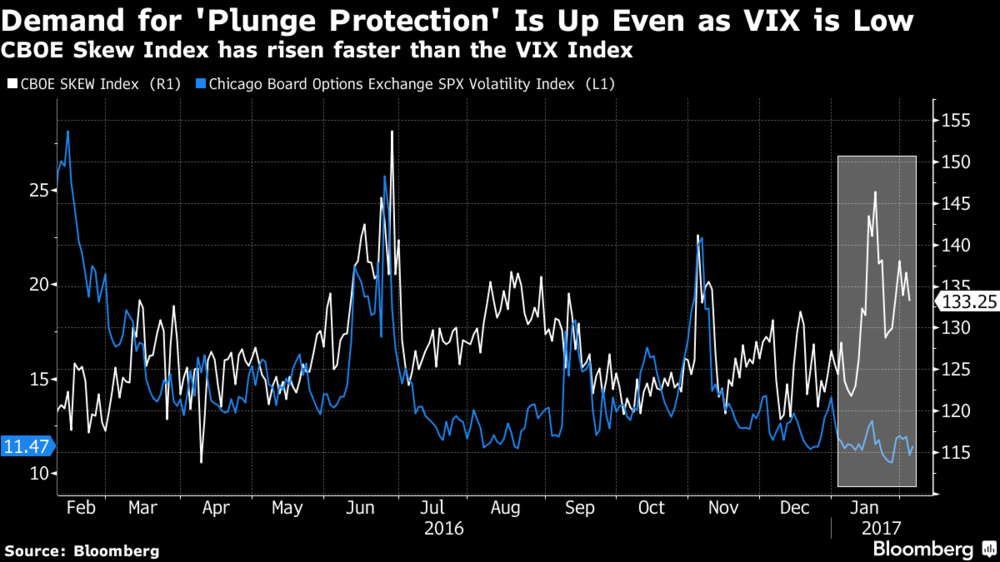
Chicago Board Options Exchange SKEW Index, SPX Volatility Index Compared |
| The article concludes by saying that it is important to watch rising bond yields and rising gold prices. We note that this was a toxic combination which was seen in the 1970s. The article concludes: |
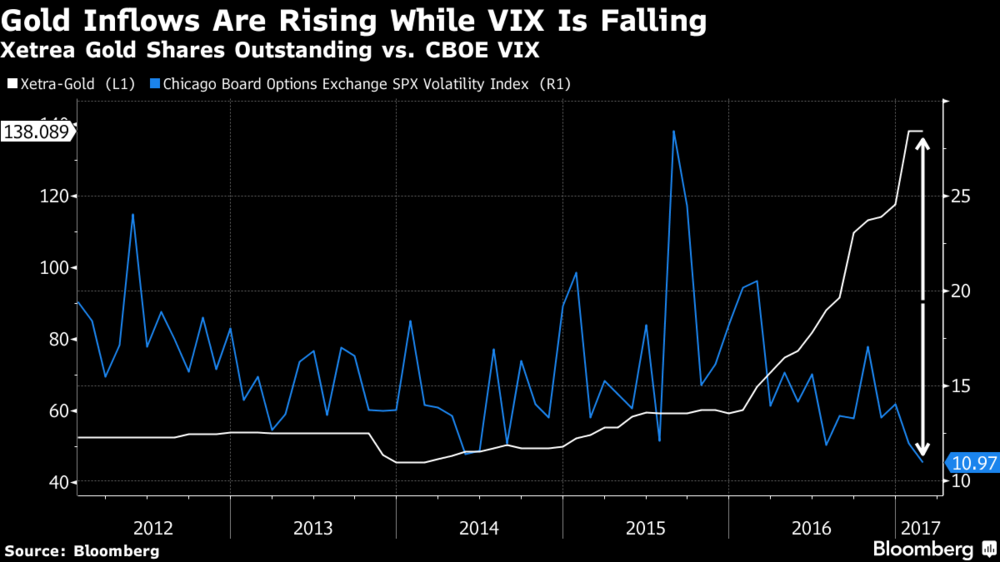
Xetrea Gold vs Chicago Board Options Exchange SPX Volatility Index 2012 - 2017 |
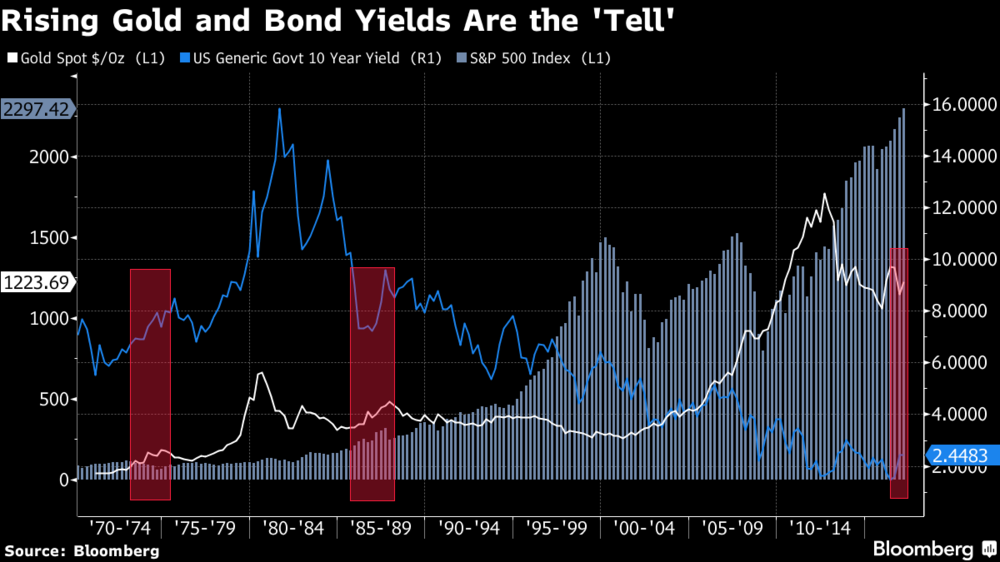
| “Gold may prove the “tell,” according to Chris Flanagan, also at Bank of America. He advises investors to watch “for the combo of rising yields and rising gold prices to signal impending market volatility.” Three consecutive quarters of rising benchmark bond yields and gold prices preceded previous market falls including the 1973-1974 bond market crash and Black Monday in 1987, he says. The yield on the benchmark 10-year U.S. Treasury has risen to 2.44 percent from 1.77 percent since Trump’s election win. Gold has moved sideways.” |
Gold Stop, US 10 Year Yield, S&P 500 Index Compared(see more posts on S&P 500 Index, U.S. Treasuries, ) |
Read the full article on Bloomberg here
Full story here Are you the author? Previous post See more for Next post
Tags: Daily Market Update,newslettersent,S&P 500 Index,U.S. Treasuries


