Lance Roberts
My articles My offerMy siteAbout meMy videosMy books
Follow on:TwitterSeeking AlphaFacebookAmazon
🔎 At a Glance
- Earnings Estimate Revisions Are Very Optimistic
- Market Brief & Technical Review
- From Lance's Desk: A Robot Economy: Who Gets Rich, Who Gets Left Behind - RIA
- Market stats, screens, and risk indicators
🏛️ Market Brief - Earnings Are Driving The Market
The S&P 500 and Nasdaq closed at fresh all-time highs for the second consecutive week, with the broader index adding roughly 1.4% to finish near 7,330. Markets were led by communication services, energy, information technology, and consumer discretionary, while materials, industrials, and health care lagged. The geopolitical overhang defining the prior ten weeks is now background noise, and the market is trading on what it always ultimately trades on: earnings.
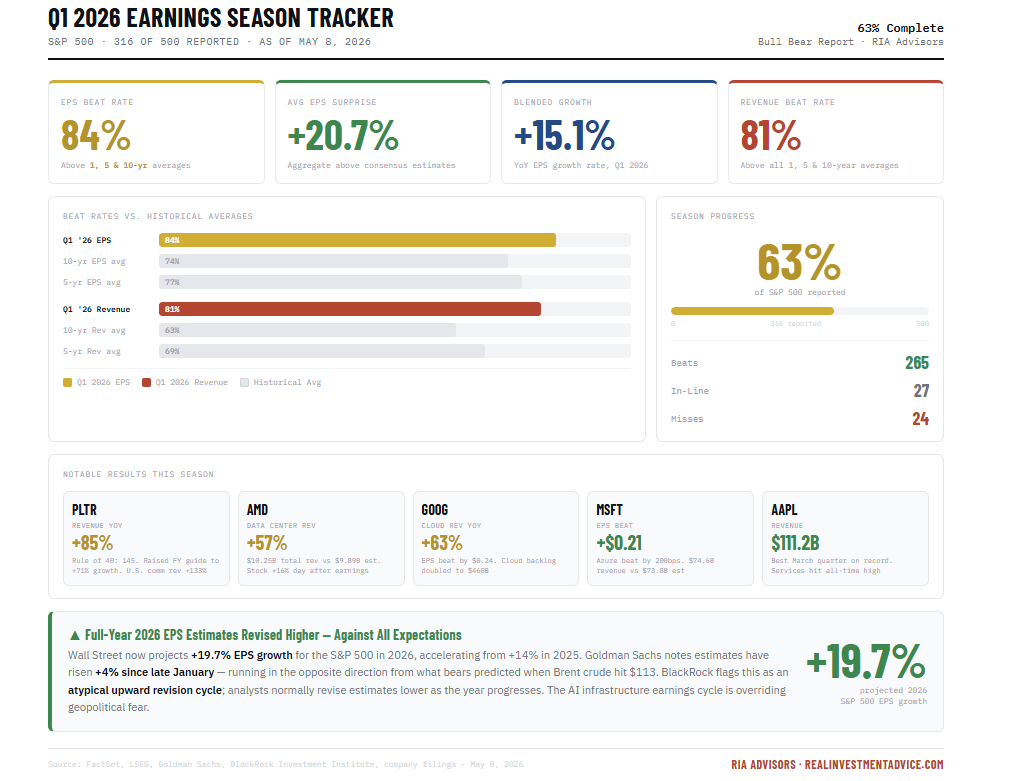
The week's most important print came on Monday after the close. Palantir's earnings report was what can only be described as a statement quarter. Revenue surged 85% year-over-year to $1.63 billion, against a $1.54 billion estimate, the fastest growth since the company went public in 2020, while adjusted EPS of $0.33 beat the $0.28 consensus. Management guided Q2 revenue to $1.8 billion, well above the $1.68 billion expectation, and raised full-year guidance to $7.65–$7.66 billion, implying 71% growth for 2026. The most striking detail: U.S. commercial revenue grew 133% year-over-year to $595 million. U.S. government revenue rose 84% to $687 million, and the company's Rule of 40 score hit 145%. That is a figure CEO Alex Karp noted is matched only by Nvidia, Micron, and SK Hynix.
Tuesday brought AMD. The company reported adjusted EPS of $1.37, beating estimates of $1.29, on revenue of $10.25 billion, versus the $9.89 billion consensus, a 38% year-over-year revenue increase. Data center revenue surged 57% to $5.8 billion, and CEO Lisa Su said the company has "strong and increasing confidence" in its ability to reach tens of billions in data center AI revenue next year. The stock jumped 16% on Wednesday. Taken together, Palantir and AMD confirm what Alphabet signaled the prior week: the AI infrastructure buildout is not slowing, and the earnings leverage from that cycle is just beginning to show up at scale.
With roughly 63% of S&P 500 companies having reported, 84% have beaten EPS estimates by an aggregate of 20.7% above consensus. Wall Street now projects S&P 500 EPS growth of 19.7% for 2026, accelerating from 14% in 2025. An atypical pattern of upward revisions has continued; analysts typically revise estimates lower as the year progresses, but 2026 is running in the opposite direction.

With respect to Iran, the extended ceasefire held but remained fragile. Iran submitted a new proposal, "relaxing negotiation conditions." However, President Trump said he was "not satisfied," but did announce an indefinite extension of the ceasefire. Brent crude drifted down into the $95–$100 range, which is high, but no longer the volatility engine it was in March.
One cautionary note deserves mention. Market breadth has dropped to its narrowest level since the dotcom era, with index gains concentrated in a handful of mega-cap AI names. This is typically a warning sign of an upcoming correction. Records are being set, but fewer and fewer stocks are doing the lifting. That divergence rarely resolves favorably indefinitely. Respect the trend, but watch the internals.
📈Technical Backdrop - Pullback Likely
The S&P 500 closed Friday at a new all-time high of 7,398.93, up 0.84% and roughly 17.5% off the March lows. But the headline masks a critical divergence. Friday’s Nasdaq surged 1.71% while the Dow gained just 0.02%. The S&P Tech sector rose 3.27% Friday and is up 35% since April 27th. Micron hit an all-time high (+25% in one week). AMD gained 15%. Meanwhile, Thursday’s internals told a different story: decliners outnumbered advancers 1.8-to-1, with only 18 new highs against 11 new lows. This week’s rally was overwhelmingly a semiconductor and AI chase, not a broad market improvement. The April jobs beat (115K vs. 65K expected) provided cover, but the money is flowing into one trade.
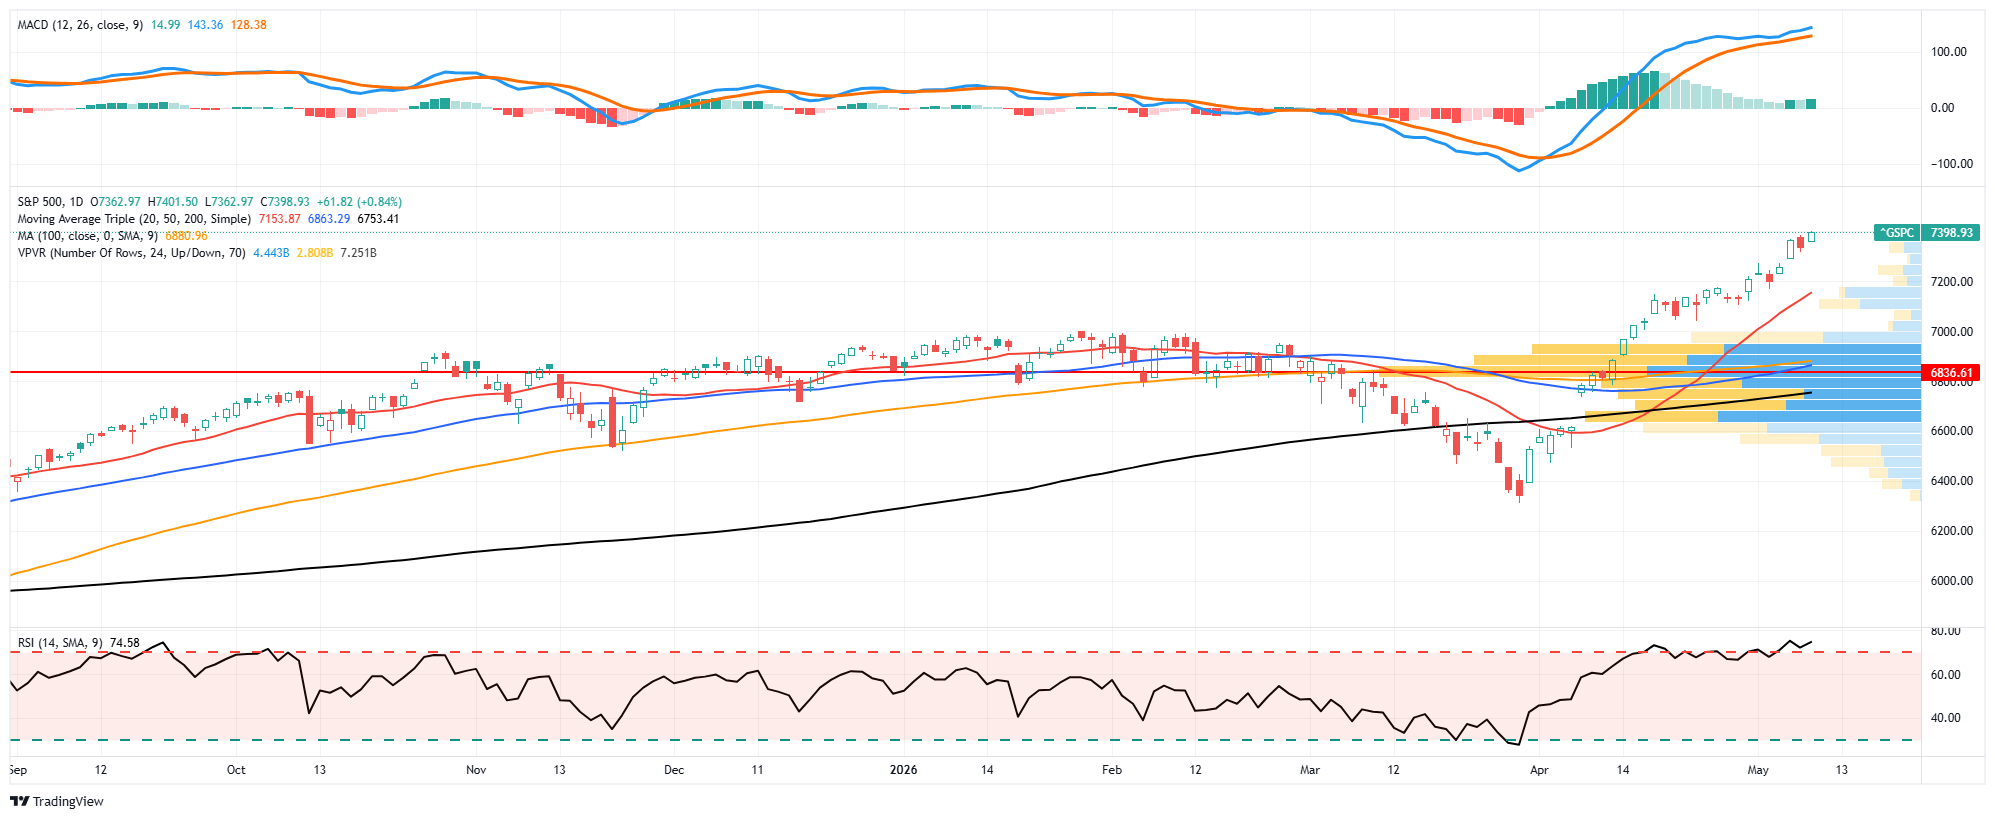
The 14-day RSI has surged to 74.58, deep into overbought territory and the highest since January’s peak. RSI above 70 has preceded every 2%+ pullback since June 2024. Investtech flagged the index as overbought after a break above the upper parallel channel, a condition in which past false breakouts have occurred. The index trades 7.2% above the 50-DMA (~6,863) and 8.7% above the 200-DMA (~6,753). Deviations of this magnitude historically revert within 2–4 weeks, producing pullbacks of 3–5%. The MACD is at the most extended reading of the year. Every indicator says “buy,” and that unanimity is itself a contrarian warning. As the old saying goes: "When no one is left to buy, who provides the next bid?"
The risk of corrective action remains high. Semiconductors are flashing exhaustion on diminishing volume, the hallmark of a trade running out of fuel. Western Digital’s 8% intraday collapse this week was an early signal of what happens when the most extended names gap down. The more probable near-term outcome is not a crash but a rotation: capital moving out of exhausted semi-leaders into lagging sectors. If orderly, the S&P churns sideways while the 50-DMA catches up. If disorderly, potentially triggered by an Iran escalation or hot CPI, a 3–5% pullback to 7000, or the 50-DMA below that, comes fast.
Bottom line: This is not a market to initiate new longs at the highs. The trend remains bullish, but trends that move this far, this fast, always revert to the mean. The question is how, not if. Tighten stops, take profits in extended semi names, and build a buy list for the pullback. Patience pays. Trade accordingly.
🔑 Key Catalysts Next Week
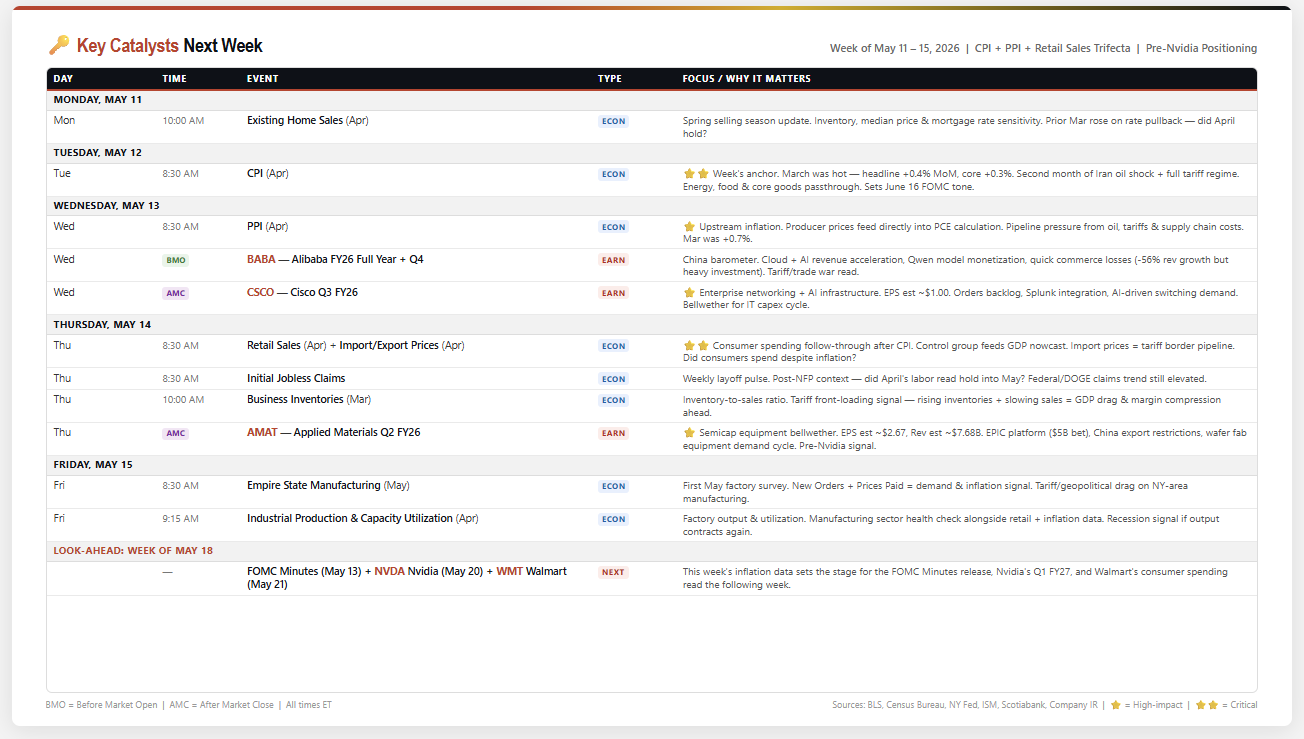
After two weeks of Magnificent 7 earnings and payrolls data, the calendar pivots back to the macro gauntlet that will define the Fed's June path. Tuesday's April CPI, Wednesday's April PPI, and Thursday's April Retail Sales create a three-day inflation-consumer trifecta that will either confirm or break the "higher for longer" trade heading into the June 16 FOMC meeting. This week isn't about individual stocks; it's about the price level and the consumer's willingness to pay it.
Tuesday's April CPI is the week's anchor. March ran hot with the headline at +0.4% MoM and the core reading rising +0.3%. That reflected the first full month of the Iranian oil shock and the broadened tariff regime. April is the second month of that regime, and the question is whether the acceleration was a one-month spike or the beginning of a new trend. Energy prices eased modestly in late April as Iran ceasefire talks gained traction, potentially providing a one-month offset. But core goods, where tariff passthrough lives, won't have that benefit. Used car prices, which had been masking tariff pressure in prior months, are no longer declining. Shelter costs remain stubbornly elevated. If the headline comes in above +0.3% MoM or core reaccelerates, summer rate-cut expectations are dead.
Wednesday's PPI doubles down. Producer prices feed directly into the PCE calculation that the Fed actually targets. March PPI printed a blistering +0.7%, the hottest monthly reading in over a year. April PPI tells us whether the upstream pipeline is still pressurized or whether oil's modest pullback and easing supply chains provided relief. A PPI-to-CPI passthrough story is forming: if producers are absorbing cost increases now, margins will compress, and earnings will be revised down. If they're passing them through, consumer inflation stays elevated, and the Fed stays on hold. Either outcome is negative for someone.
On the earnings side, this is the bridge week between Big Tech and the Nvidia event on May 20th. Cisco, on Wednesday after the close, is the enterprise IT capex bellwether. AI-driven switching demand, progress on Splunk integration, and the order backlog will tell us whether corporate technology spending is holding up or pulling back amid macro uncertainty. Alibaba Wednesday morning is the China read on cloud and AI revenue from the Qwen model, quick commerce investment, and tariff/trade war impact on cross-border commerce. Applied Materials on Thursday after the close is the semiconductor capital equipment signal ahead of Nvidia, its $5 billion EPIC platform bet, and wafer fab equipment orders are the leading indicator for chip manufacturing capacity expansion.
CPI will tell us where inflation is, while PPI tells us where it's going. Retail Sales on Thursday will tell us whether the consumer breaks before the Fed blinks. Three data points, three days, one narrative. If all three run hot, the "higher for longer" trade hardens into "higher for the foreseeable future," and risk assets may begin to reprice. This is why we continue to suggest maintaining portfolio management practices carefully.
Need Help With Your Investing Strategy?
Are you looking for comprehensive financial, insurance, and estate planning services? Need a risk-managed portfolio management strategy to grow and protect your savings? Whatever your needs are, we are here to help.

💰 Earnings Estimate Revisions Are Very Optimistic
Last week, we discussed the S&P earnings record and why such record earnings could be a warning for the market. I want to continue that discussion by focusing not only on what has happened but also on what is expected to happen in the future. While the Q1 2026 earnings results are spectacular, so far, the earnings estimate revisions behind them are the real story.
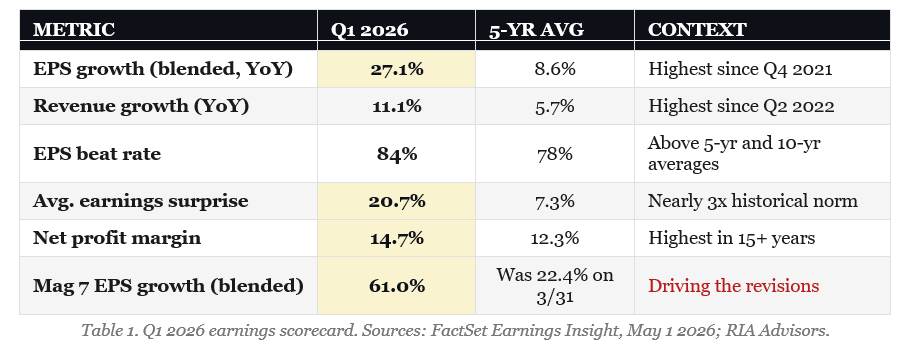
The first-quarter 2026 earnings season is delivering results that Wall Street rarely sees. With roughly two-thirds of the S&P 500 having reported, the blended growth rate has climbed to 27.1% year-over-year, more than double the 13.2% that consensus modeled at the end of the quarter on March 31. If that figure holds, it will be the strongest year-over-year print since the post-COVID rebound quarter of Q4 2021. 84% of companies have beaten EPS, 81% have beaten revenue, and the average earnings surprise sits at 20.7%, nearly three times the 5-year average of 7.3%.
That's the surface story. The more interesting question, and the one investors should be asking, is why analysts were so wrong heading in, and what it means that they're now revising earnings estimates higher with a velocity that has almost no historical parallel.
Look at Morgan Stanley's chart of consensus 2026 earnings estimate revisions versus history. In any normal year, by the time Q1 earnings season rolls around, analysts have been quietly walking earnings estimates down for six months. The historical median revision pattern drifts from 1.00 in January to roughly 0.92 by year-end. Two years of cuts. That's the analyst playbook. Start the year too optimistic, get reset by reality, and end the year right.

This year is doing the opposite. The 2026 earnings estimate index cratered to 0.96 last summer during the Iran shock, then turned vertical. By May, it's broken above 1.06. We're looking at a roughly 14-point swing in earnings estimates relative to the historical pattern. That is what Morgan Stanley calls “fairly unprecedented,” and that's analyst-speak for something they don't have a clean comparison for.
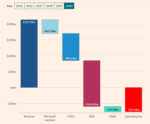
The Mag 7 alone moved from a 22.4% expected growth rate at the end of March to a 61% blended print today. Four of the top five contributors to S&P 500 earnings growth this quarter are Alphabet, NVIDIA, Amazon, and Meta. The same four names driving index returns are now driving the earnings estimate revisions. That's not a coincidence, and there is more to this story as noted by Sage Road Research:
"The AI distortion goes beyond stock prices to profits. Total S&P 500 earnings are on track to rocket 27% higher in the first quarter, FactSet estimates. But profits for the Mag-7 alone will be up 61%; for the other 493, just 16%, a figure itself inflated by semiconductor companies like Micron. This is skewing the division of the economic pie between capital and labor. As profits gallop ahead, labor compensation (wages and benefits) grew just 3.1% annualized in the first quarter, and actually shrank 0.5% after inflation, the Labor Department reported Thursday. Labor’s share of total business-sector output fell to 54.1%, the lowest since records began in 1947." - @TrevorNoren
So, if it isn't consumers' and subsequently economic growth, driving earnings estimate revisions, then what is?
What's Actually Driving the Upside
Three things are happening at once, and we have to separate them.
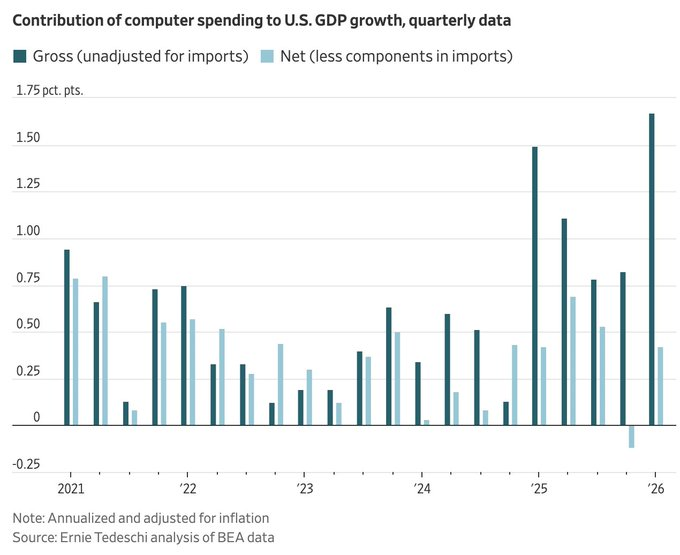
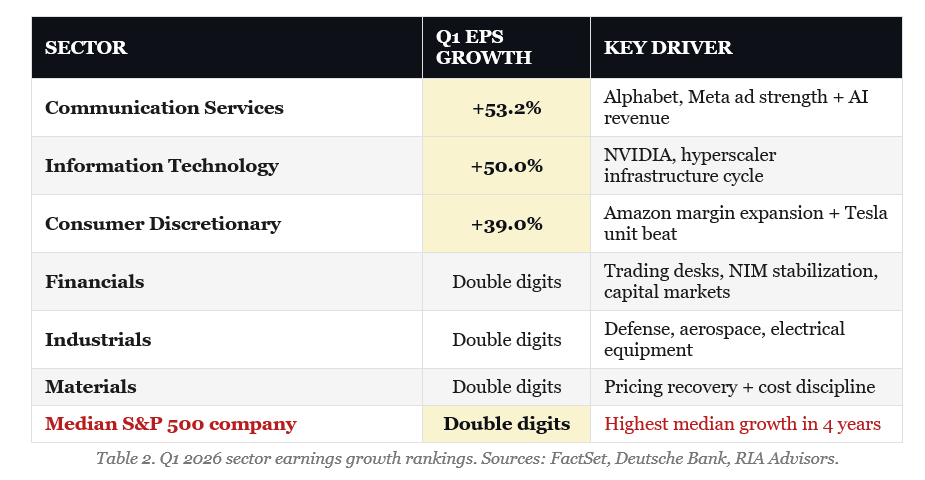
First, the AI capex cycle is finally showing up in the income statement. Hyperscalers have spent the better part of two years building out compute. The revenue is now landing. Communication Services is reporting +53% earnings growth, Tech is at +50%, and Consumer Discretionary is at +39%. Those aren't soft beats. They're the result of capex that was already locked in before the quarter started.
Second, margins are at a record. The blended Q1 net profit margin came in at 14.7%, the highest reading in over 15 years. That's the real engine behind the surprise factor. Revenues grew 11.1%, which is solid but not extraordinary. The gap between 11% revenue growth and 27% earnings growth is operating leverage. A company that cut 8% of its workforce in 2023 and held headcount flat through 2025 is now monetizing every dollar of incremental revenue at a much higher incremental margin.
Third, breadth in Q1 results is finally improving. The Deutsche Bank charts make this point clearly. Earnings growth for the median S&P 500 company is now in the double digits, the highest reading in four years. All eleven sectors are tracking positive growth for the first time since 2022. Margins for “the rest” of the index, the 493 names outside the Mag 7, are turning higher after a steady three-year decline. Operating cash flow for non-financial corporates is running near 20% year-over-year. Q1 results are genuinely broader than they have been in years, and that deserves credit. But there's an important asterisk on this point that I'll address in the next section.
The Asterisk on "Broadening"
Now we have to separate two things that get confused in the headlines. Q1 reported earnings broadened, but the forward-year earnings estimate revisions did not. Those are different statements about different time horizons, and the difference matters.
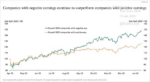
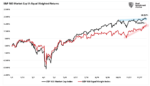
Goldman Sachs published a chart in early May that quantifies the gap. The bank tracks a basket of AI infrastructure stocks (S&P 500 constituents in their AI Semiconductors, AI Data Centers, and Power Up America baskets) and compares it to the broader index on cumulative 2026 EPS revisions since December 2024. The numbers are striking.

AI infrastructure stocks have seen 2026 earnings estimates revised higher by 55% since December 2024. The full S&P 500 is up 7%. The S&P 500 ex-AI infrastructure is down 1%. Read that last figure twice. Strip out chip designers, hyperscaler infrastructure, AI data centers, and the power and grid names that feed them, and the remaining 470-odd companies in the index have collectively had their 2026 earnings estimates revised lower over the past 17 months. Not flat. Lower.
This is the cleanest picture of concentration risk you'll see this cycle. The narrow-market critique, which has been valid for 2 years, isn't going away, even after Q1 results came in. It's hiding inside the index math. Mega-cap AI names have absolute earnings dollars so dominant that even modest forward growth in their numbers swamps the rest of the 500. When analysts publish their 2026 earnings estimate consensus forecast for the index, they're effectively publishing a forecast for roughly 30 companies. The other 470 are a rounding error to the headline.
“Strip AI infrastructure out of the index, and 2026 estimates are actually lower than they were 17 months ago.”
The implication for portfolio construction is direct. If you own a market-cap-weighted S&P 500 index fund, you don't own the diversified earnings stream the marketing material implies. You own a concentrated AI infrastructure bet wrapped in a passive vehicle. The two largest holdings in the SPY are Nvidia and Microsoft. Apple, Amazon, Meta, Alphabet, and Broadcom round out the top eight. Seven of the top eight names are direct AI infrastructure plays. That's not diversification. That's a thematic fund with 490 other names attached for legal reasons.
None of this is bearish on AI itself. The capex cycle is real, the earnings growth is landing, and the demand picture remains durable. The point is more subtle. The index's strength masks the weakness of its components. If AI infrastructure names hit a single quarter of disappointment, whether from capex digestion, an export control surprise, or simple revenue deceleration, there's no second engine in the index to absorb the impact. Equal-weighted measures of breadth being healthy on Q1 results don't fix the forward-revision concentration problem. They are two different problems.
Here is What Nobody Wants to Talk About
Here's where I have to put the brakes on. When earnings estimates are revised this hard, this fast, you have to ask whether the market is pricing the beat or the trend. Because historically, vertical earnings estimate revisions are a late-cycle phenomenon, not an early one.
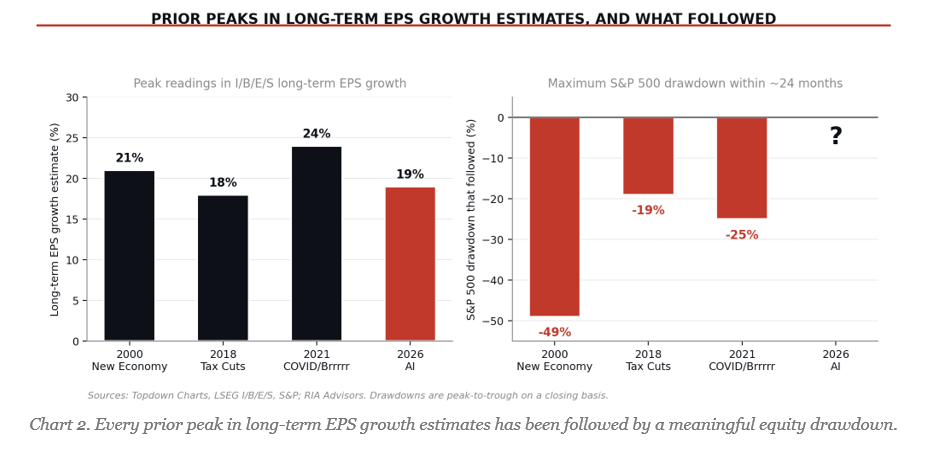
Notice the long-term S&P 500 earnings growth estimate chart. The current reading sits near 19%, the highest print since 2000. The chart's prior peaks tell a story. The “New Economy” peak in 2000. The “Tax Cuts” peak in 2018. The “COVID” rebound peak in 2021. Every one of those readings was followed by a meaningful drawdown in equities and a sharp downward revision cycle in earnings within twelve to twenty-four months. Forecasts above the long-term trend channel have a poor history.
“When everybody is revising higher, the marginal trade is no longer to buy the beats. It's to fade the next miss.”
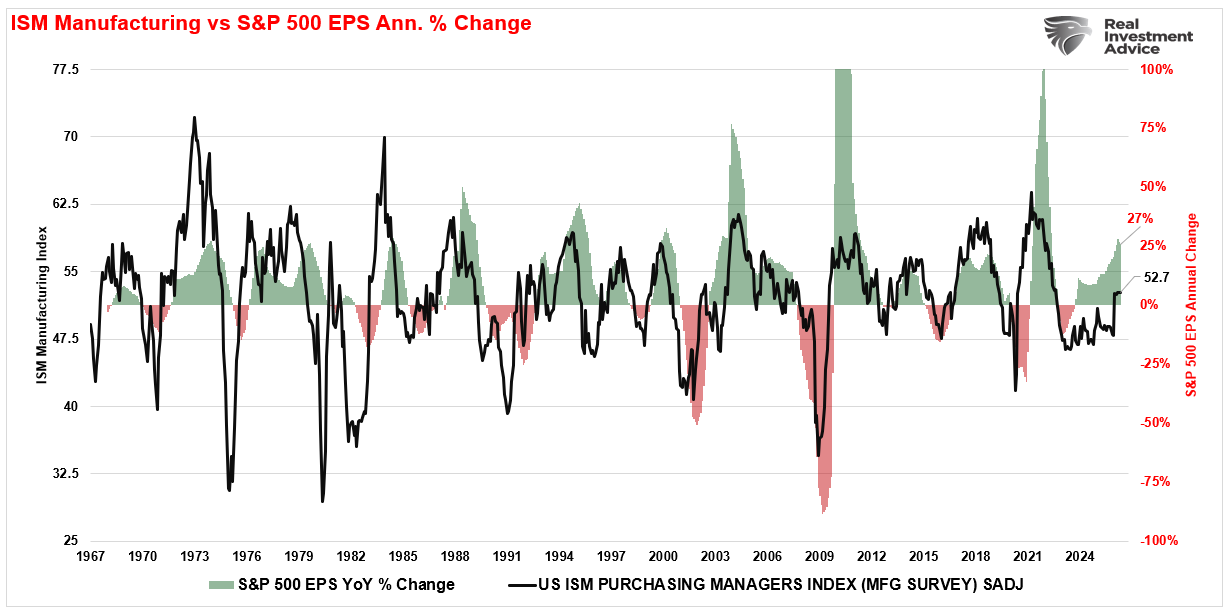
The other tell is the divergence between hard data and earnings. ISM Manufacturing is sitting in the low 50s, barely above the contraction line. The S&P 500 is up roughly 19% year over year. That gap historically closes one of two ways. Either ISM rallies into the high 50s as the cycle accelerates, or earnings get marked down to meet the macro. The latter has happened more often than the former at this point in a cycle.
This Summer is Where Headwinds Rise
There's a calendar problem stacking up behind these numbers. The Q1 print benefited from easy year-over-year comparisons. Q2 won't have that tailwind. By the time July prints arrive, the comparison base resets to 2025's stronger second-quarter results, which means the same level of underlying earnings translates into a much smaller growth rate. That mechanical effect alone could pull the headline growth rate from 27% back into the low double digits, even if absolute earnings keep climbing. Markets don't always distinguish between “growth slowing” and “earnings missing.” They tend to react to the headline number first and sort it out later.
Then there's the bond market setup. The 10-year is still trading near 4.4%, the front end is pricing barely two cuts for the rest of the year, and core inflation has been sticky in the high 2s for six months. If the AI capex cycle keeps running hot, that's incremental demand for chips, electricity, and skilled labor, all of which feed into the inputs the Fed watches. The risk isn't a recession scare. It's a “no cuts, maybe a hike” repricing that historically chops 5% to 8% off equity valuations in short order.
Positioning is the other variable. Sentiment surveys are stretched. Equity allocations among retail and institutional investors are at multi-year highs. CTAs are max long. When everyone is on the same side of a trade, and the data starts to disappoint, price discovery is brutal because there are no marginal buyers left to absorb the unwind.

Institutions Are On Risk Watch
The most useful way to gauge the risk landscape is to look at what institutional trading desks are actually doing, not just what they're saying. The substance of the conversations across the buy-side and the dealer community is converging on a single posture: stay long, but explicitly hedge. The same desks publishing constructive twelve-month equity targets are simultaneously paying for downside protection in size. That's the tell.
Five points are worth laying out.
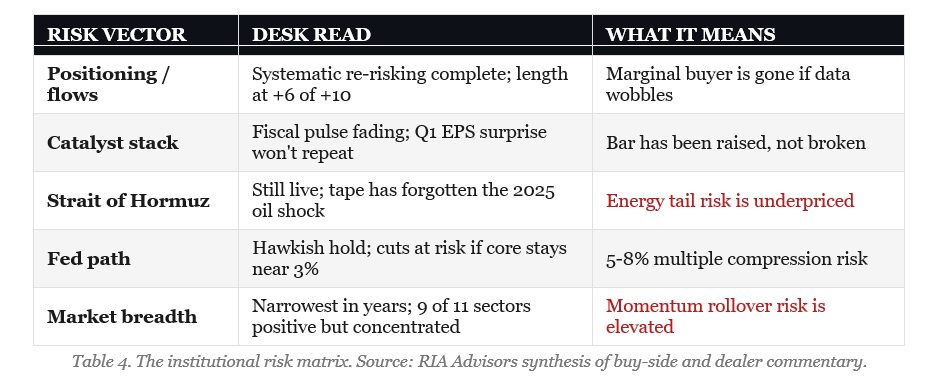
- First, positioning. The Nasdaq 100 just delivered its biggest monthly gain in over 23 years. A move of that magnitude has consequences for who is left to buy. Systematic strategies (CTAs, vol-target funds, risk parity) have completed their re-risking. The buy-the-dip retail bid has been engaged since the March lows. Discretionary trading desks are now running long exposure at around +6 on a -10 to +10 scale, up from -4 at the March lows. The marginal buyer in this tape has already shown up. From here, the question is who steps in if the data disappoints.
- Second, the fundamental catalyst stack is largely behind us. The fiscal pulse that supported corporate margins is fading. The Q1 EPS print of 27% will not repeat against tougher comparisons. The operating leverage that drove the surprise factor cannot keep expanding indefinitely. The combination means the next four quarters of earnings reports face a higher bar with less wind at their backs.
- Third, the Strait of Hormuz is still live. The tape has effectively forgotten last summer's oil shock. That's how markets work. We discount tail risk after the immediate catalyst passes, but the underlying geopolitical setup has not materially improved. A single headline can reprice oil 4% in a session, and equities are positioned for a benign energy backdrop that may not hold.
- Fourth, the Fed is constrained. Last week's hawkish hold told us where the committee sits when core inflation prints closer to 3% than 2%. The base case for cuts in September and December assumes labor market softening that has not yet arrived. If those cuts get pushed, the equity multiple has to absorb the disappointment, and historically that costs the index 5% to 8% in short order.
- Fifth, narrow breadth is a real risk that history takes seriously. Most standard measures of S&P breadth are exceptionally thin right now. Nine of eleven sectors are positive on the year, which sounds healthy on the surface, but participation under the index headline is concentrated in a handful of mega-cap names. The strongest historical conclusion isn't that narrow breadth is bearish (because, for two years, it hasn't been), but that it raises the probability of a momentum rollover when the rotation eventually breaks. You don't pick that fight. You do prepare for it.
Here's the practical math that ties this back to portfolio action. One-month at-the-money puts on the S&P 500 are currently priced at less than 2% of the spot price. For investors carrying meaningful long exposure into a summer with the stack of risks described above, that's compelling risk transfer. The same institutional desks publishing constructive twelve-month equity views are paying for that protection right now. They call it “the cost of a good night's sleep.” That phrase belongs in every portfolio review this quarter.
What Should Investors Do Now
Q1 was a genuinely strong quarter. Margins are real. Cash flow is real. The broadening is real. None of that is in dispute. What's worth disputing is the assumption baked into consensus. An 18.6% full-year forecast assumes the run rate from Q1 just delivered continues for three more quarters, with no margin compression, no demand weakness, and no AI capex digestion. That's a stack of optimistic assumptions, and the historical record on stacks like that is unkind.
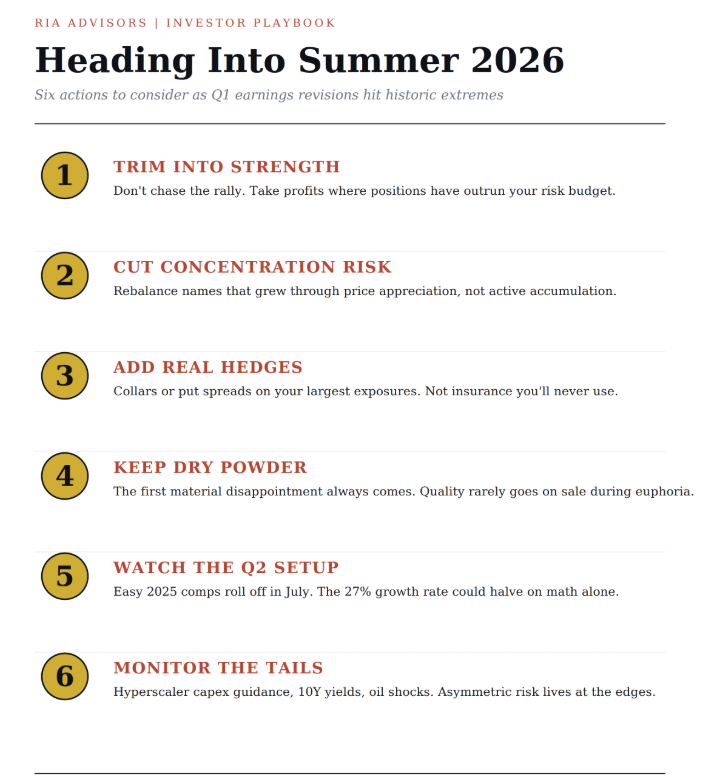
For investors, the playbook into summer is unchanged in direction but tighter in execution. Trim into strength rather than chase. Reduce concentration in the names that have done the most work, especially where position sizes have crept up from price appreciation rather than active accumulation. Add hedges, not insurance you'll never use, but actual collars or put spreads on the largest exposures. Keep dry powder for the first material disappointment, because it always comes, and the names worth owning rarely go on sale during euphoria.
The setup that worries me isn't that earnings are bad. It's that they're so good the bar has been raised to a level that historically marks a peak, not a launching pad. When everybody is revising higher, the marginal trade is no longer to buy the beats. It's to fade the next miss. That moment usually arrives without warning, and the pattern has held in every prior cycle that produced a chart like the one in front of us today.
Stay long, but stay hedged. The asymmetry has shifted.
🖊️ From Lance’s Desk
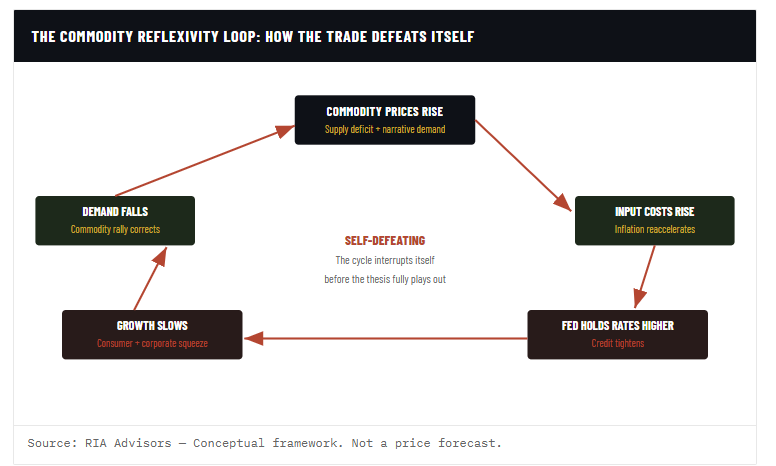
This week's #MacroView blog is Part 1, examining the narrative of a "commodity supercycle," why it is historically a boom-bust cycle, and how to navigate it.

Also Posted This Week:
- Gold Bugs Faulty Thesis: M2 and Inflation - RIA - by Michael Lebowitz
- Market Correction Risk: Why Summer 2026 Looks Risky - RIA - by Lance Roberts
📹 Watch & Listen
For four years, investors have been told the next crash was right around the corner. Russia-Ukraine, inflation at 9%, Fed rate hikes, Silicon Valley Bank, tariffs, AI fears, Iran tensions, and endless recession warnings all fueled bearish headlines. Yet despite every crisis narrative, the market has doubled from the October 2022 lows.
Subscribe To Our YouTube Channel To Get Notified Of All Our Videos
📊 Market Statistics & Analysis
Weekly technical overview across key sectors, risk indicators, and market internals

💸 Market & Sector X-Ray: Market Cracks Support
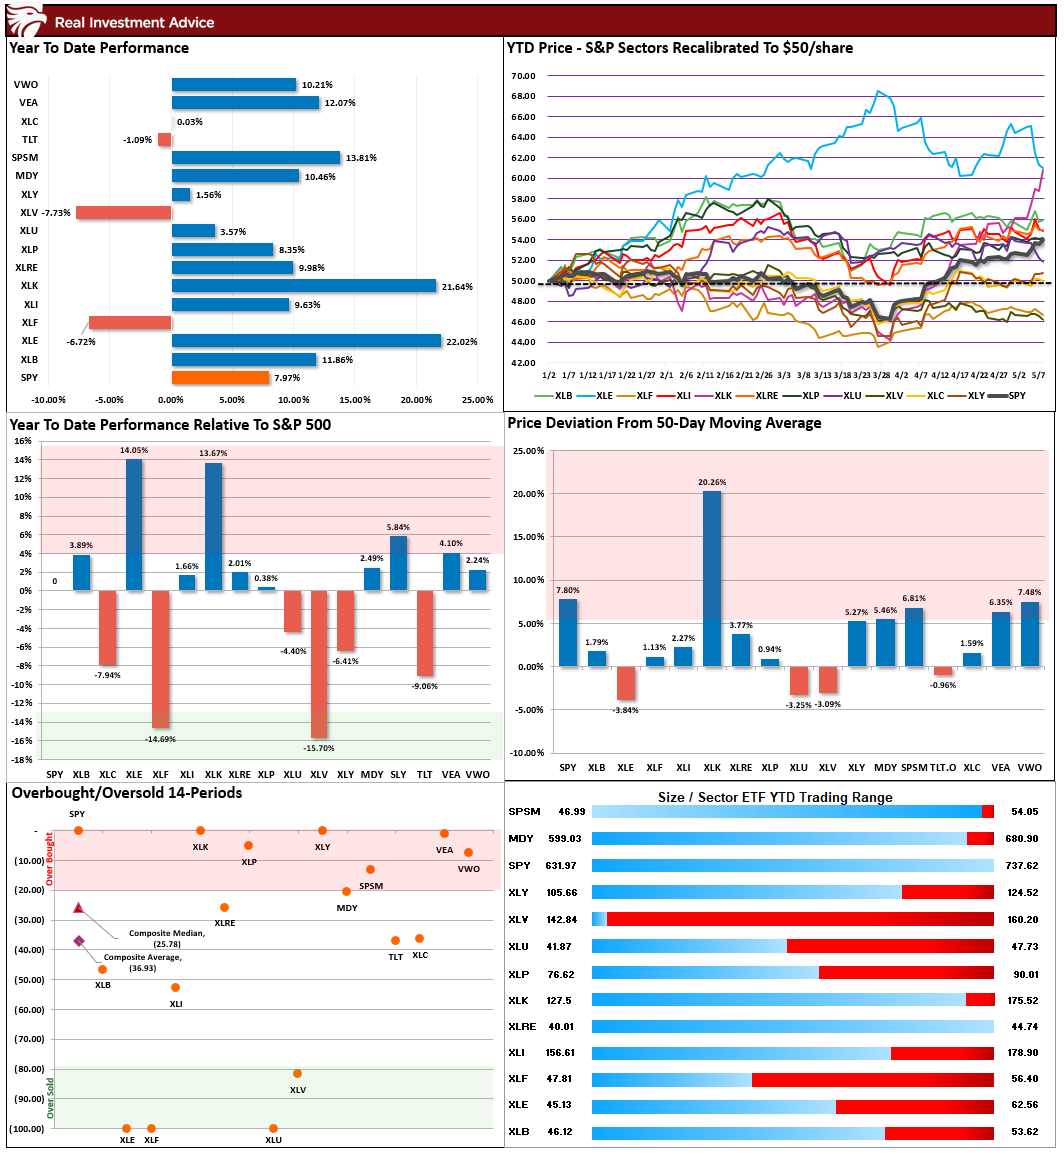
The surge in Technology over the last two weeks has been nothing short of remarkable, and that sector has now caught up with the Energy trade from earlier this year. With the market up about 7% this year, it has largely been driven by Semiconductors leading the charge. The market is now bifurcated, which historically suggests we could see a rather rapid internal market rotation (risk on to risk off), so manage exposures accordingly.
📐 Technical Composite: 86.61 - Market Overbought
In early April, during an interview, we noted that a 10-15% rally from the lows was not out of the question. That market has now eclipsed 17% and seems poised to keep going higher. However, as the market becomes more overbought, it won't take much to trigger a reversal. Take profits and rebalance risk.

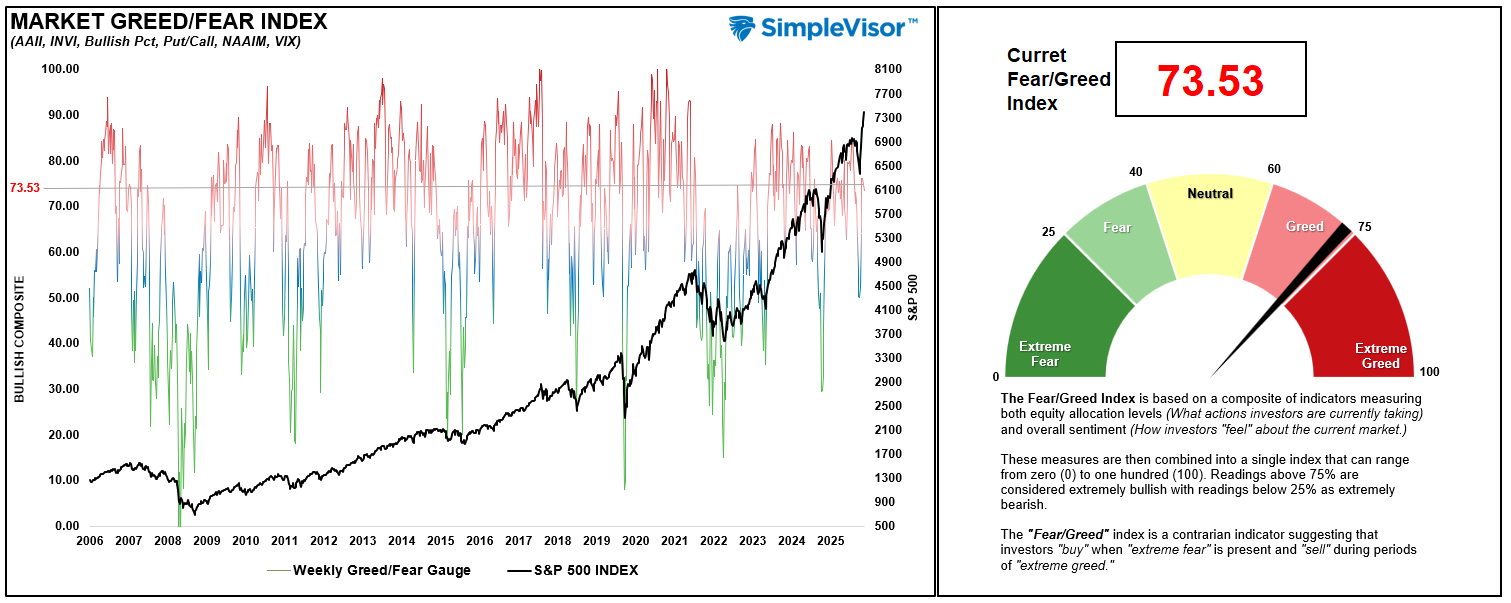
🤑 Fear/Greed Index: 73.53 – Pushing Extreme Greed
Investor sentiment and positioning are bordering on extreme greed. Put call ratios are surging, bullish sentiment is rising, and speculative positioning is very aggressive. While that does not mean a "crash" is coming, it does suggest that the risk of a reversal is rising. Trade accordingly.
🔁 Relative Sector Performance
As noted last week: "It didn't take long, but the previous most 'out of favor' sector, Technology, reverted to the most overbought, while Communications, Financials, and Healthcare are now the most out of favor." That continues to remain the case this past week, and the deviation has become even more significant with Technology the most overbought that we have seen historically with a reading of .93 out of 1.00. A rotation is likely, but a catalyst is needed.

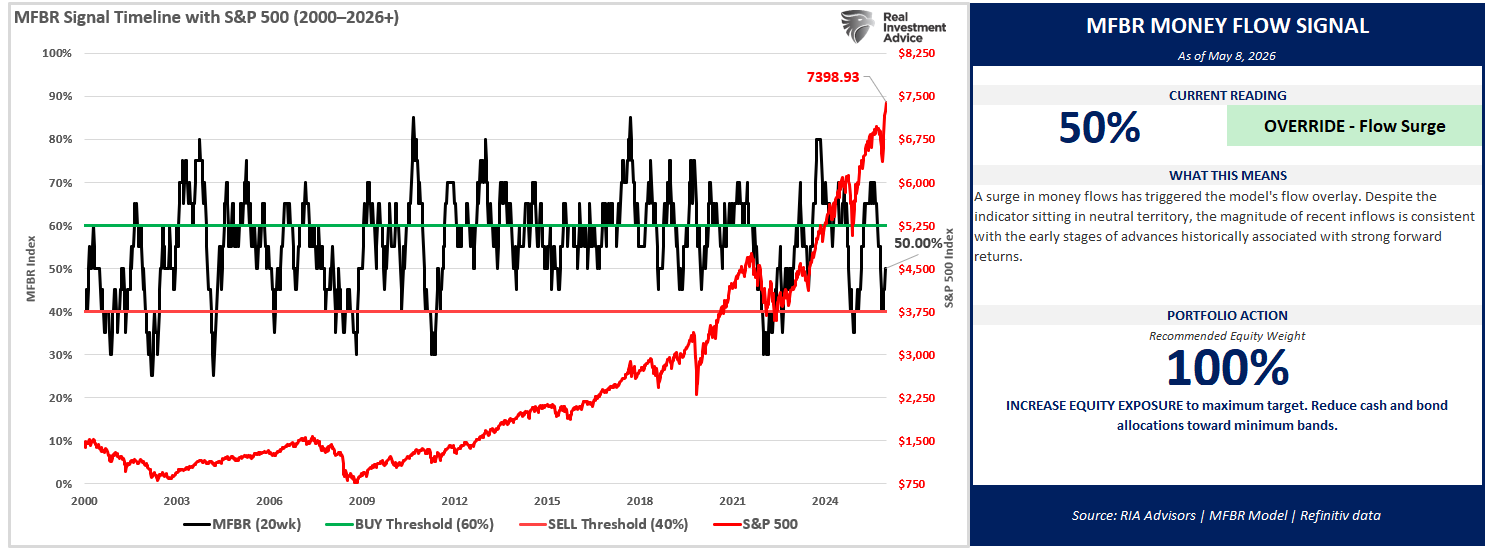
📊 MFBR Index (Money Flow/Breadth Ratio Indicator): 45% = Neutral/Bullish
NEW! MFBR Index: The Money Flow Breadth Ratio (MFBR) model is a rules-based equity allocation framework that uses weekly S&P 500 money flow data to generate buy, sell, and neutral signals. It is designed to systematically adjust portfolio equity exposure in response to the direction and persistence of institutional capital flows, aiming to reduce drawdowns while capturing the majority of market upside.
"As of May 8, 2026, with the S&P 500 at 7,398.93, the Money Flow Breadth Ratio (MFBR) stands at 50% and rising. This places the indicator in the 50-60% range, triggering a OVERRIDE - Flow Surge signal. The prior week reading was 50%, representing a 5% decline over the trailing four weeks. The model currently recommends increasing equity exposure aggressively, with a target equity weight of 100%. This reflects a FLOW-OVERLAY OVERRIDE: the trailing 4-week net dollar flow has swung sharply positive (>$300B) after a deeply negative prior 4 weeks, a historically strong contrarian buy signal.
Flow-overlay override is ACTIVE and locks full equity exposure for up to 4 weeks. The model's 25-year backtest shows this signal captures major post-correction rallies that breadth-only readings miss. This override is rare and time-limited (4-week lock). Monitor for signs of follow-through confirmation."
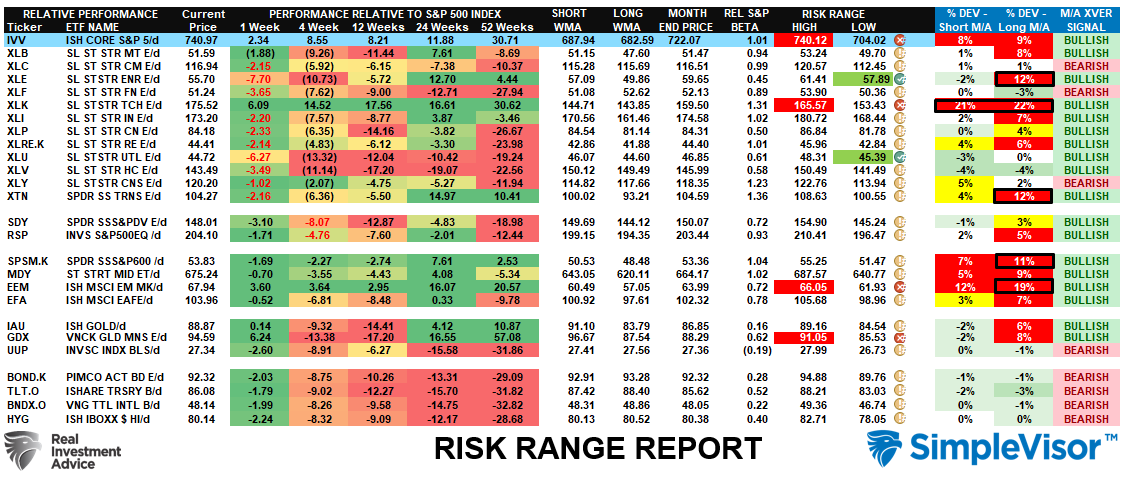
📊 Sector Model & Risk Ranges
As we noted last week, "The good news is that the market has recovered and the bulls are back in control. The bad news is that there are numerous extreme deviations from long-term weekly means. Basic Materials, Energy, Technology, Transportation, Small Caps, and Emerging Markets are all 10% or more above their long-term weekly means, which generally precede mean-reversions. Take profits and rebalance accordingly." That remains the case this week, as well.
Have a great week.
Lance Roberts, CIO, RIA Advisors
The post Earnings Estimate Revisions Are Very Optimistic appeared first on RIA.
Full story here Are you the author?You Might Also Like
 S&P Earnings Record May Be A Warning
2026-05-02
🔎 At a Glance 🏛️ Market Brief – Mag Earnings Accelerate Rally The S&P 500 closed at a fresh all-time high Friday, capping a week in which the market did something remarkable: it largely stopped caring about Iran. That wasn’t recklessness. It was earnings. Five of the Magnificent Seven reported this week, and the results …
2026-04-27
As of this writing, the Strait of Hormuz remains effectively closed since February 28. Roughly 20% of the world’s seaborne oil stopped moving through the chokepoint. The International Energy Agency described the event as “the largest supply disruption in the history of the global oil market.” Gulf producers shut in nearly 9 million barrels a day …
 M2 Money Supply: Is 45% Growth Really Inflationary?
2026-03-18
A client sent us the quote below from Michael Oliver of Momentum Structural Analysis and asked for our comments regarding gold and the growth of the M2 money supply: “…if you are taking profits in gold and putting that into cash Dollars, thinking that’s a good idea, then go to the St. Louis Fed’s site …
 Investment Risk Is Underappreciated
2026-01-24
🔎 At a Glance 🏛️ Market Brief – The “Greenland” Impact This week’s markets were driven by headline risk, economic uncertainty, and the early innings of earnings season. With the markets closed last Monday for the Martin Luther King holiday, U.S. equities sold off sharply on Tuesday. President Trump’s tariff threats against key European allies, …
 Rotation Continues As Markets Remain Bullish
2026-01-17
Sector rotation is this weekend’s 2026 Investment Summit. I am presenting at the conference as you are reading this. However, I would be remiss not to share a brief market update as we head into next week. The full newsletter will return next week. That said, U.S. equity markets delivered mixed performance last week. Major …
2025-12-03
Starting in the aftermath of the 2008 financial crisis, a profound change to the Fed’s liquidity-providing role in the capital markets was underway. We can sum up the Fed regime change with a popular quip: The Fed has shifted from lender of last resort to the lender of only resort! In our articles QE Is …
 HSBC Casts Doubt On OpenAI’s Future
2025-12-01
Per the Financial Times (LINK), HSBC has serious doubts about OpenAI’s financial wherewithal. The following bullet points outline HSBC’s assumptions, which highlight the challenging financial path OpenAI faces. The graphic below from the article shows that HSBC expects OpenAI to run a massive operating loss in the year 2030. Accordingly, they have serious concerns about …
Tags: Featured,newsletter