


Lance Roberts
My articles My offerMy siteAbout meMy videosMy books
Follow on:TwitterSeeking AlphaFacebookAmazon
🔎 At a Glance
- Q1 Earnings Season Begins: Buy Or Fade The Rally?
- Market Brief & Technical Review
- From Lance's Desk: Oil Shock: Will The Fed Intervene (Part 2) - RIA
- Market stats, screens, and risk indicators
🏛️ Market Brief - Stocks Surge On Relief
Note: I am traveling home from the UK today, so this week's missive will be short. Also, I had to write it on Friday before the U.S. markets officially closed. So, any discrepancies will be corrected next week when the full newsletter returns are returned.
Five weeks of losses, one ceasefire announcement, and the market exhaled — at least for now.
The week opened on a knife's edge. Trump's self-imposed deadline for Iran to reopen the Strait of Hormuz or face escalation kept futures volatile and conviction thin. Monday churned with no direction, the S&P closing essentially flat. Tuesday was similarly tortured. The index swung by more than 1% intraday before settling with a 0.08% gain as Pakistan urged a two-week extension.
Then came Wednesday.
Shortly before 8 p.m. Tuesday evening, President Trump posted that he had agreed to suspend attacks on Iran for two weeks. Furthermore, the US and Iran were "very far along" on a long-term peace agreement. Markets didn't wait for morning. The Dow surged 1,325 points, its best single session since April 2025. The S&P 500 popped 2.51% to 6,782.81, and the Nasdaq jumped 2.80%. Most consequentially, WTI crude collapsed 16.4%, its largest single-day drop since April 2020, settling at $94.41 per barrel. Treasury yields fell sharply, with the 10-year dropping to 4.25%, and rate-hike odds retreated
As we noted previously, the offside positioning had gotten so bearish that a short-covering rally had become very probable. This is why the "best 10-days of the markets often occur alongside the 10-worst days."
That Wednesday rally pushed the market back above the 200-day moving average. Then, on Thursday, the rally extended, with the S&P adding another 0.62% even as oil edged back above $97. That rally reclaimed the 20- and 50-day moving averages, effectively ending the correction that began in March. Of course, the ceasefire's fragility was not lost on anyone. JPMorgan's Jamie Dimon warned the conflict risks were making inflation "stickier" and rates "higher than markets expect." It is a cold reminder that even a ceasefire doesn't undo six weeks of supply-shock damage.
The inflation data confirmed that caution is warranted. Both the February core PCE and March CPI data came in at 0.4% and 0.9% month-over-month. That matched expectations but ran well above the Fed's 2% target. Critically, this data predates the full impact of the oil shock. However, given that high oil prices eventually lead to demand destruction, the Federal Reserve will likely be less concerned about short-term fluctuations in the data.
The bottom line heading into next week: the ceasefire is a necessary, not a sufficient, condition for recovery. The Strait of Hormuz must reopen, tanker traffic must normalize, and oil must hold below $100. Only then can the inflation and rate-cut story be rewritten. However, in the near term, the Q1 earnings season begins in earnest. It will be guidance, not geopolitics, that drives the next leg from here.
📈Technical Backdrop - Market Reclaims The 200-DMA
The S&P 500 closed Friday at 6,816.89, slipping 0.11% to snap an eight-day winning streak. The week was the index’s best since November. The S&P was up roughly 3%, completing an 8.2% round-trip from the March low near 6,300. The index sits just 2.6% below January’s all-time high of 7,002, well above both the 200-DMA (~6,664) and 50-DMA (~6,559). The VIX collapsed from 31 to ~19.5, back below 20. That was the threshold we identified weeks ago as a necessary condition for a durable bottom. For the first time in this entire correction, both conditions have been met: oil has pulled back, and the VIX is below 20.
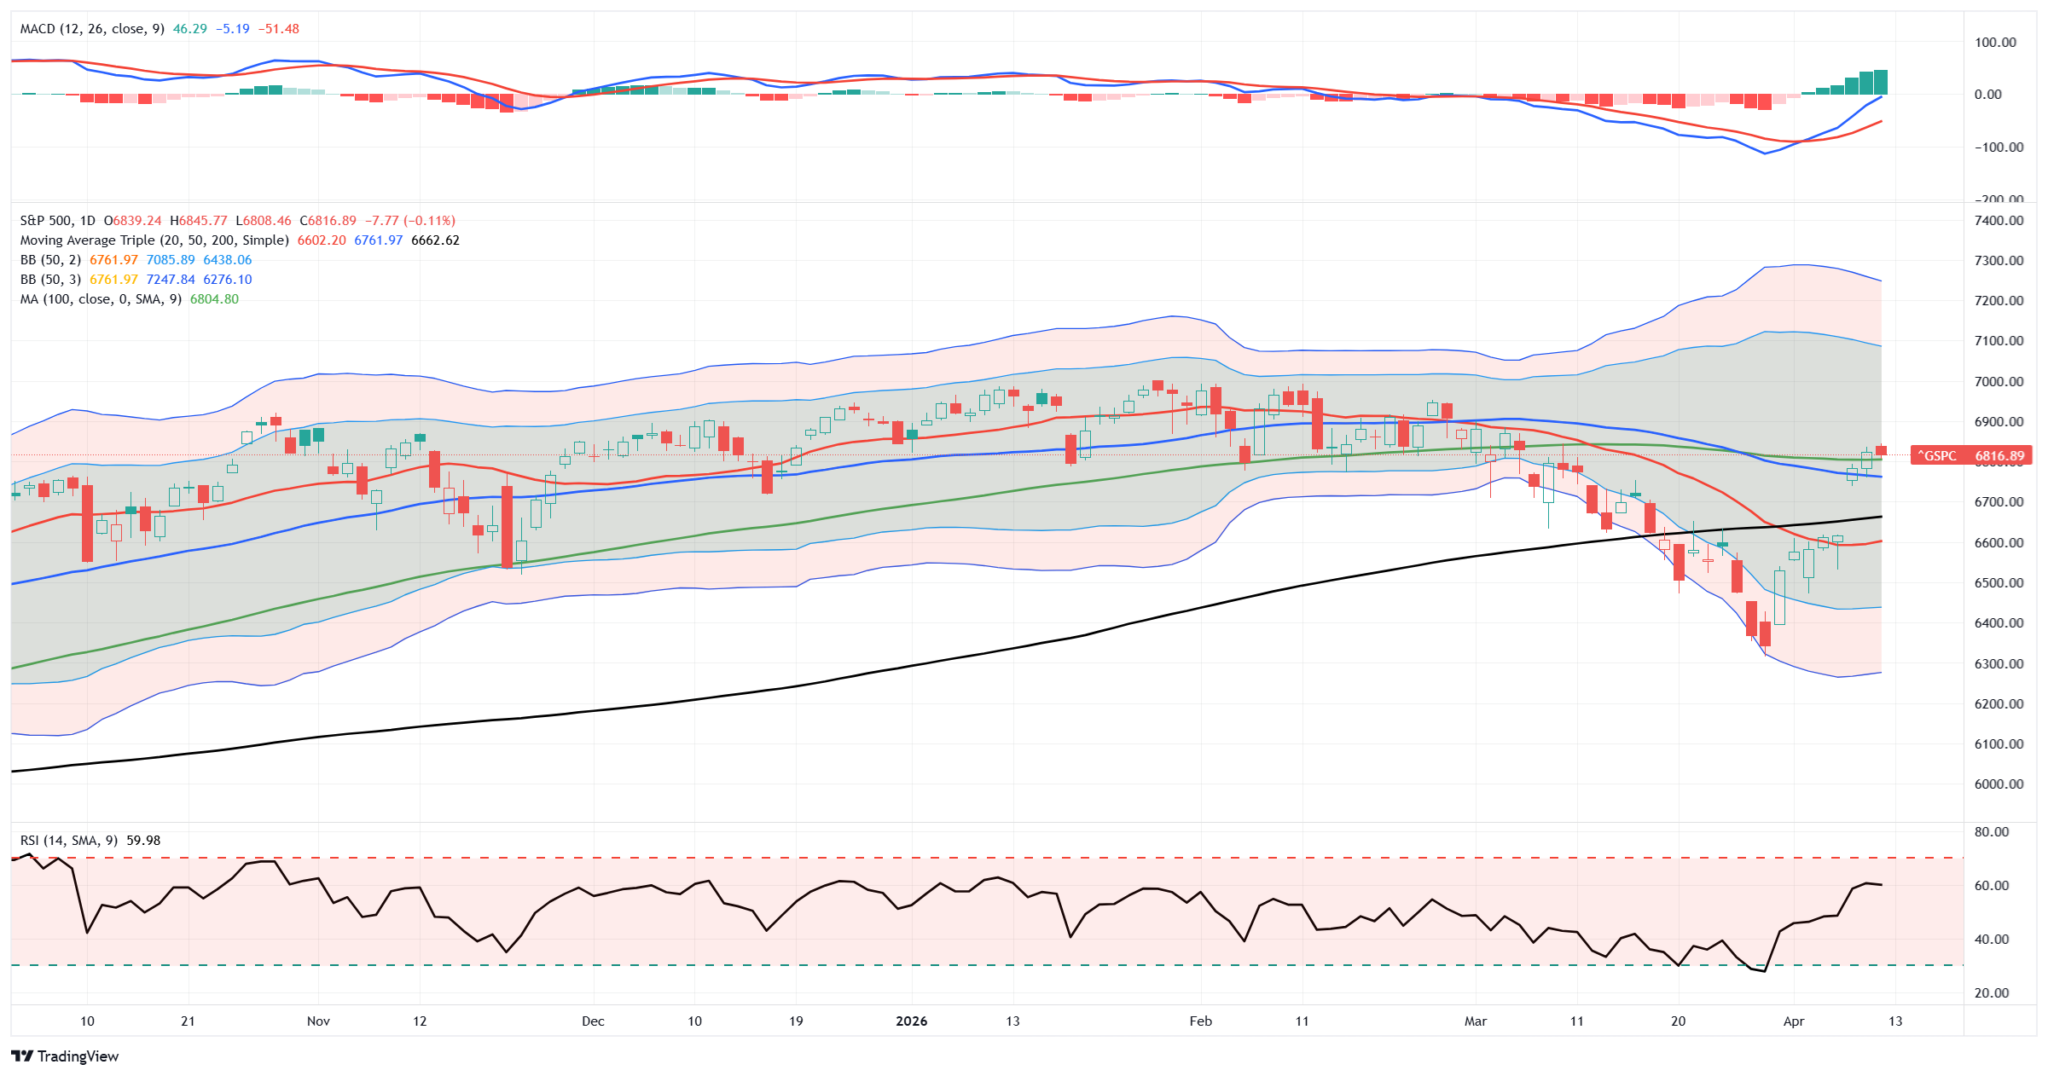
The rally, however, while powerful, was narrow. Just five stocks, AVGO, META, GOOGL, AMZN, and NVDA, accounted for roughly 45% of the S&P 500’s +760bps gain. Meanwhile, the software sector remains in a structural bear market. The IGV ETF is down ~30% YTD with names like ZS, WDAY, SNOW, and NOW all off 40%+. The “SaaSpocalypse” weighs on Nasdaq internals even as the headline reclaims key levels. The breadth test remains: 50% of constituents above the 50-DMA is the threshold for a genuine trend reversal. However, the last reading was just 27.6%.
The binary risk is clear. A Pakistan deal to reopen the Strait of Hormuz sends oil toward $80 and the S&P toward 7,000. A breakdown sends oil above $100, and the rally reverses. The market is effectively a binary bet on this weekend’s negotiations. As such, the technical picture is the best since early February. For now, both key moving averages have been reclaimed. That is the good news.
Our 200-DMA breakdown analysis from March details the outcomes of brief breaks below the key moving average. However, with 45% of the rally driven by five stocks and still depressed breadth readings, caution remains warranted. New positions are warranted on a constructive pullback to the 200-DMA (~6,664) or on a confirmed breadth expansion above 50%. For our message remains the same as last week: Cautious offense. Trade accordingly.

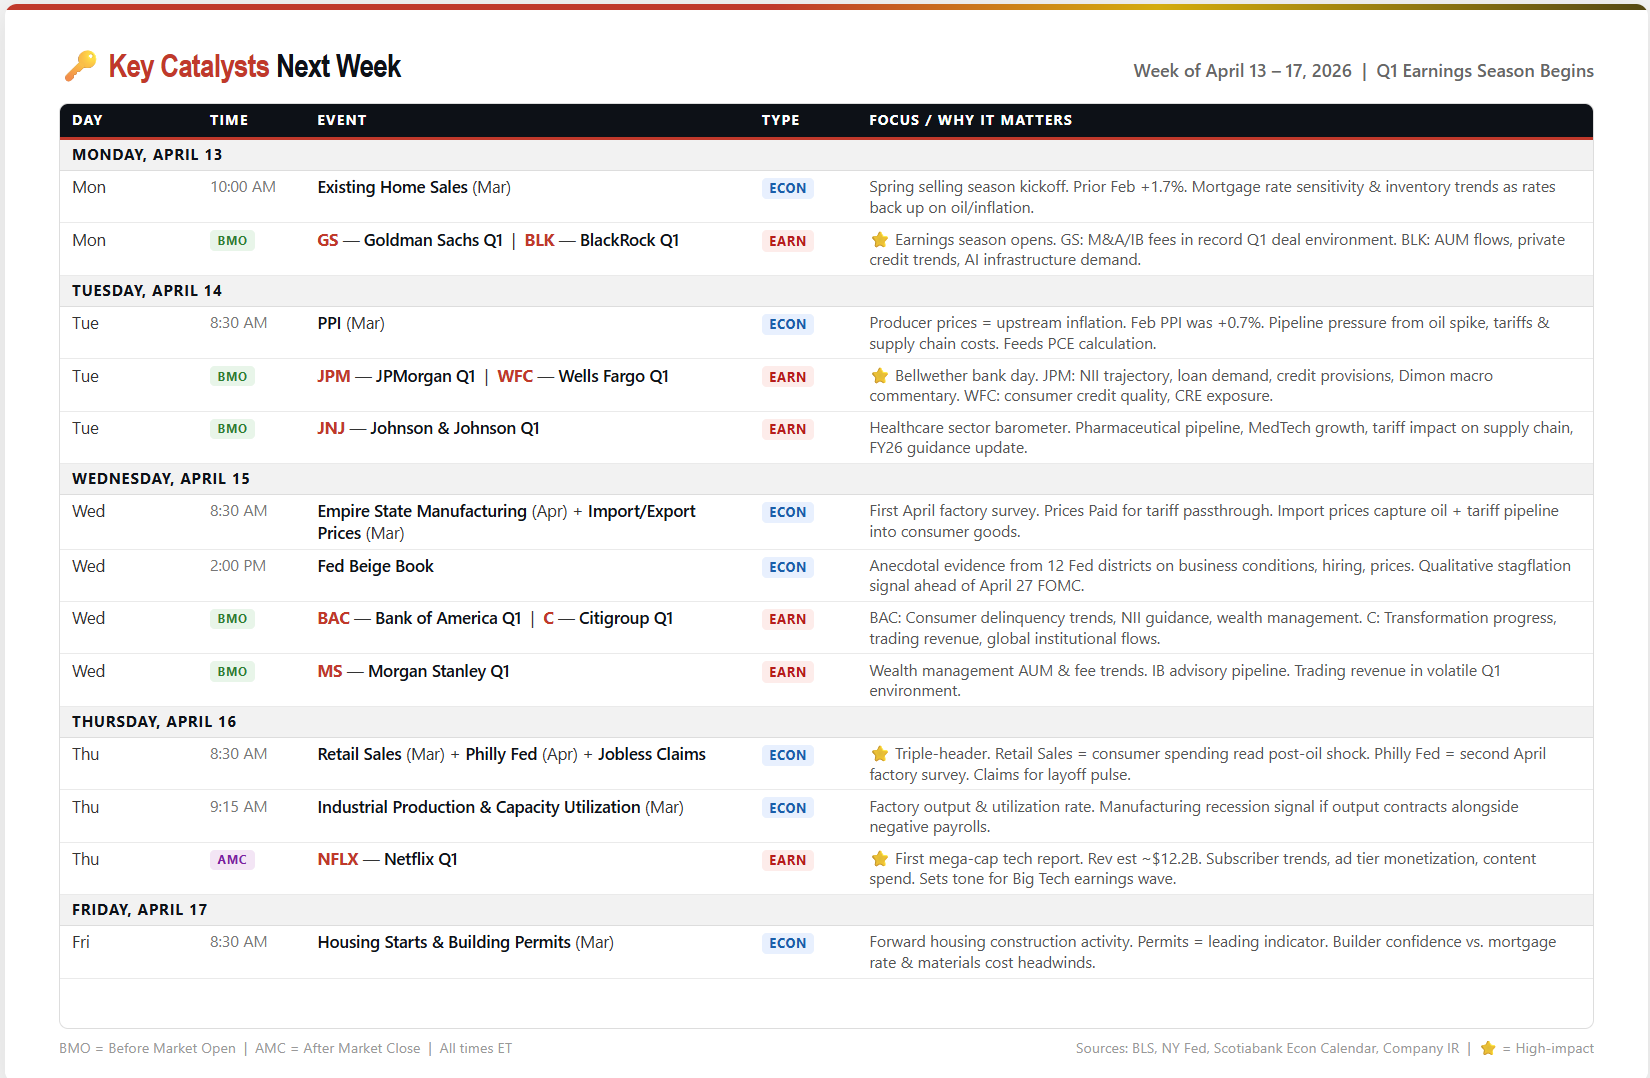
🔑 Key Catalysts Next Week
Q1 earnings season arrives in force alongside a stacked economic calendar; this is the most dense week of crosscurrents since the March FOMC. Six of the nation's largest banks report in a three-day blitz, Netflix sets the tone for mega-cap tech, and Thursday delivers a triple-header of Retail Sales, Philly Fed, and Industrial Production that will reshape the macro narrative heading into the April 27 FOMC meeting.
Goldman Sachs and BlackRock open the season Monday morning. Goldman is the M&A bellwether. Q1 set a record for deal activity, and GS derives a higher share of revenue from investment banking than any of its major peers. BlackRock's report will be watched for AUM flows, private credit exposure (a growing risk theme), and how institutional allocators positioned through the March oil shock. Tuesday escalates with JPMorgan, the market's definitive "economy report card." Jamie Dimon's macro commentary carries as much weight as the numbers.
The trajectory of net interest income, loan loss provisions, and consumer credit quality will tell us whether the March shock left scars on Main Street. Wells Fargo is alongside for the consumer banking read. Johnson & Johnson adds the healthcare sector barometer. Wednesday brings Bank of America, Citigroup, and Morgan Stanley to round out the bank earnings wave. The collective message from six megabank reports will answer whether the"soft landing" thesis survived Q1 or whether credit stress, CRE maturities, and consumer deterioration are showing up in provisions.
On the economic side, Tuesday's March PPI is the upstream inflation signal; February ran hot at +0.7%, and feeds directly into the PCE calculation that the Fed watches. Wednesday's Beige Book provides the qualitative color from all 12 Fed districts ahead of the April 27 FOMC. But Thursday is the marquee data day: March Retail Sales will reveal whether the consumer held up amid oil at $100+ and tariff price hikes; Philly Fed is the second April factory survey, alongside Empire State from Wednesday; and Industrial Production will tell us if factory output contracted alongside the negative payrolls trend. Netflix, after the close on Thursday, will be the first mega-cap tech to report and set the sentiment template for the Big Tech earnings wave that follows.
Bottom line: Banks tell us if the financial system is absorbing the shocks. Retail Sales tell us if the consumer is. Netflix tells us if growth is. All in one week. Define your risk levels before Monday's open.
Need Help With Your Investing Strategy?
Are you looking for comprehensive financial, insurance, and estate planning services? Need a risk-managed portfolio management strategy to grow and protect your savings? Whatever your needs are, we are here to help.

💰 Q1 Earnings Season Begins
As a fragile ceasefire with Iran hangs in the balance and oil trades near multi-year highs, the Q1 earnings season is arriving in one of the most negatively positioned markets in years. That backdrop may be exactly the reason it's worth reconsidering the "fade the rally" stance we posited last week. For individuals who have not been in the financial markets for very long, there is an important lesson to learn.
"The markets are designed to inflict the maximum amount of pain on the maximum number of participants at any given moment."
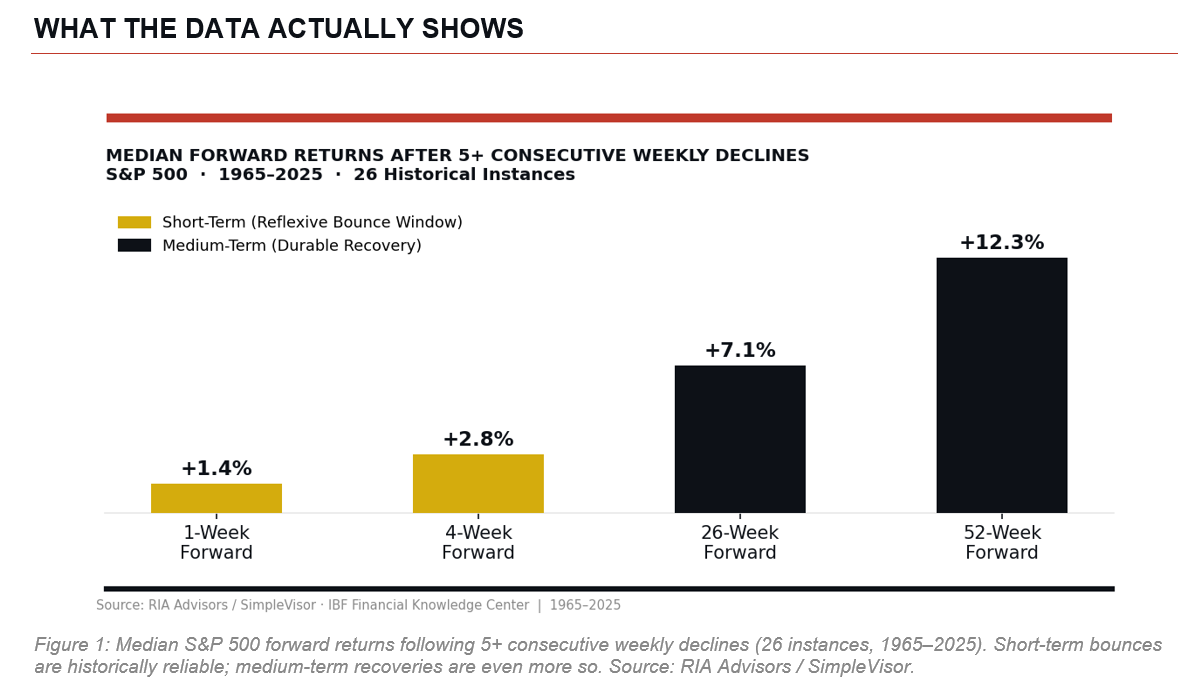
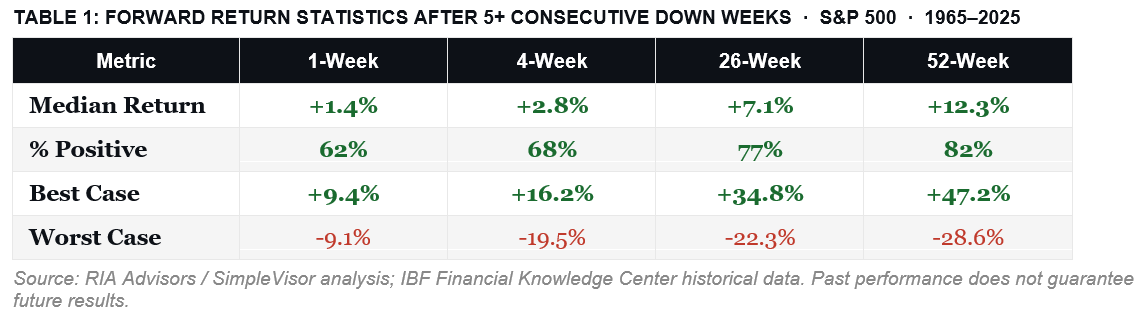
Right now, given the numerous "Purveyors of Persistent Doom" on social media, the most crowded trade on Wall Street isn't a long position...it's fear. Furthermore, as we discussed last week, after 5 weeks of consecutive declines, the market rally this past week was not unexpected.
"Since 1965, the S&P 500 has recorded 26 separate instances of five or more consecutive weekly declines. That’s roughly once every 2.3 years, and these streaks feel catastrophic in real time. This is when investors make the most mistakes over time. The emotional stress of the decline, combined with “doomsayers,” drives investors to sell at the bottom. It is important to understand that, while these streaks feel alarming in real time, historical evidence suggests they function more as contrarian buy signals than as warnings of further collapse."
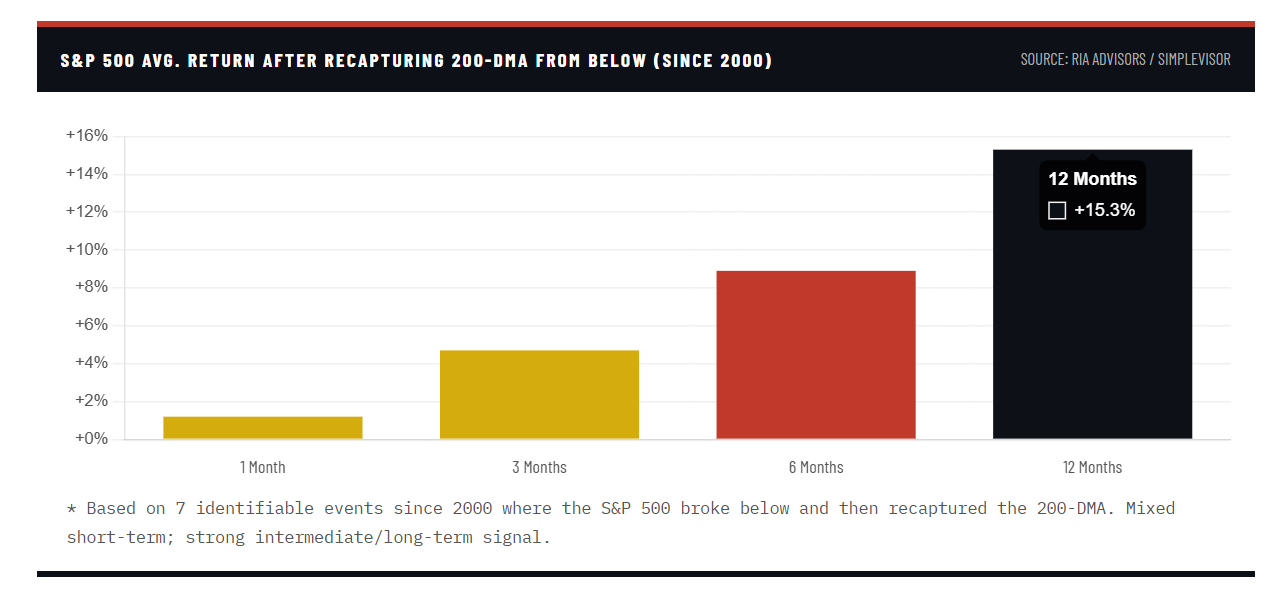
In fact, that rally was one of the strongest in nearly a year, despite the constant stream of negative headlines. The S&P 500 surged on relief that U.S.-Iran tensions had temporarily de-escalated, gaining ground and recapturing the 200-day moving average on a closing basis for the first time since the initial shock of the conflict sent it plunging through that critical floor in mid-March. That single technical event, a clean close back above the 200-DMA, changes the conversation about what comes next, especially with the Q1 earnings season now underway.
The question everyone is wrestling with is simple: do you fade this rally, or do you use it to add exposure? I've been skeptical since March, and I still have reservations. But the data is shifting, and intellectual honesty requires acknowledging that.
Three Contrarian Signals That Aren't Easy To Ignore
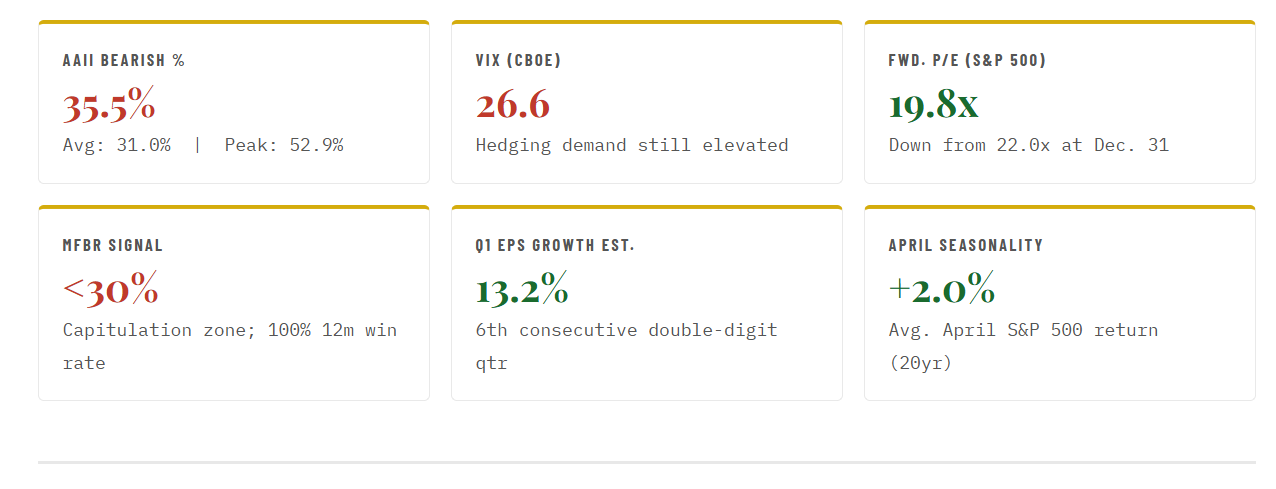
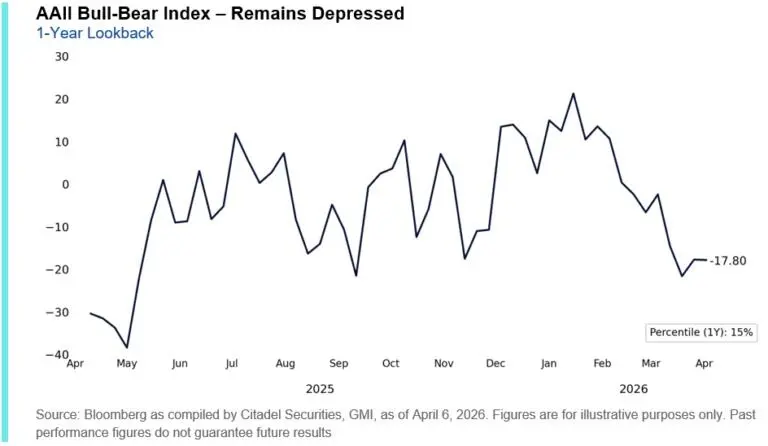
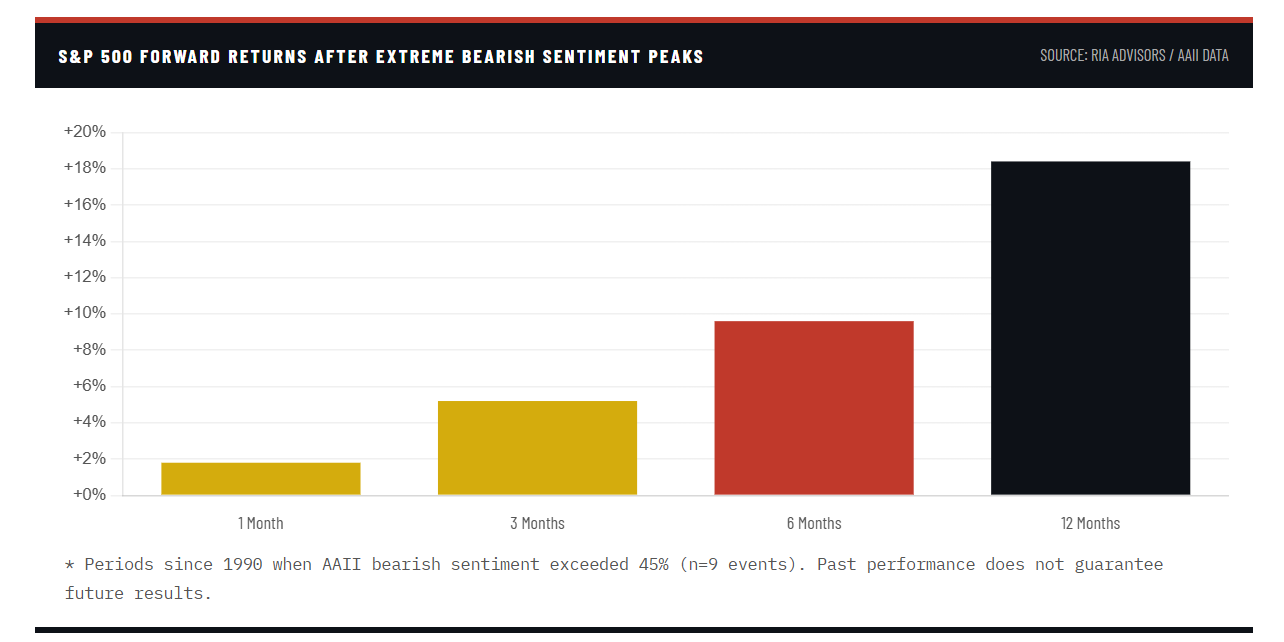
Let's start with sentiment. The AAII Sentiment Survey saw bearish readings spike to 52.9% at the March low, one of the highest in eight years and well above the long-term average of 31.0%. That has since pulled back to 35.5%, still above average, while bullish sentiment is at just 33.1%, below the historical norm of 37.5%. Historically, whenever the bull-bear spread reaches these levels of negative divergence, forward returns over the subsequent 12 months have been strongly positive. The market tends to move against the crowd, and right now, the crowd is still more scared than optimistic.
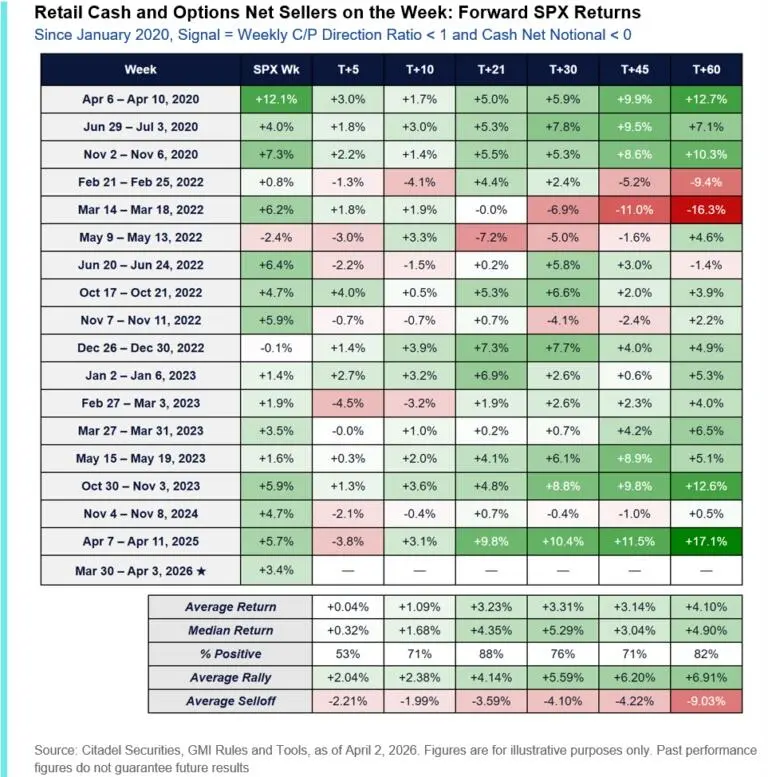
That negative sentiment has also manifested itself in the cash and options markets.
"We are now seeing early signs of retail capitulation across both cash and options. Last week, retail flows were net sellers across both platforms – an infrequent occurrence that has only been observed 18 times since January 2020 (most recently the week of April 7-11, 2025). Historically, forward returns following these signals have been positive on average, with performance improving over longer horizons. S&P 500 returns have been positive ~82% of the time by T+60, with average returns of +4.1%, and average positive returns of +6.9%." - Goldman Sachs
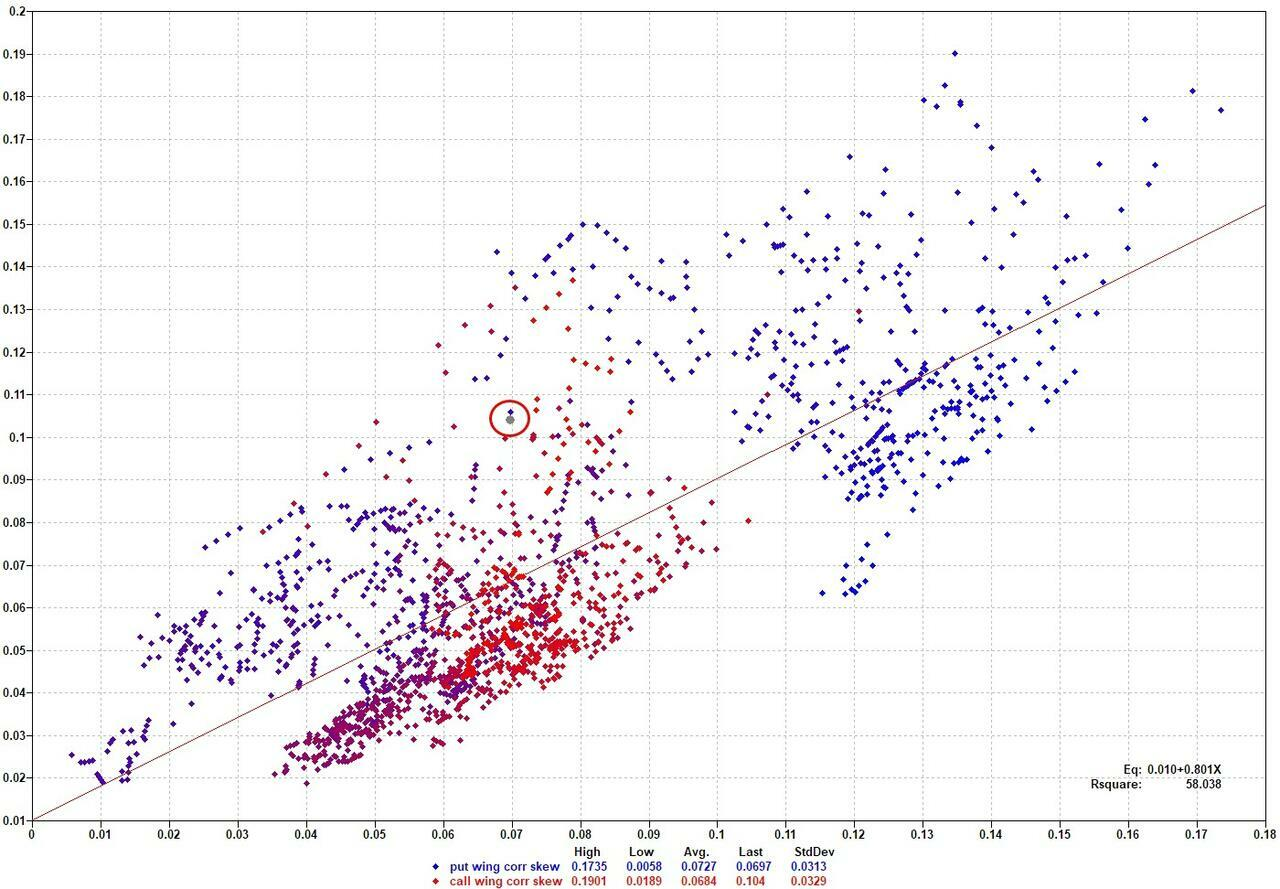
Goldman Sachs trader Shawn Tuteja recently noted that the options market's implied correlation skew has been pricing very low correlation on the call side, effectively suggesting that the right-tail risk in the S&P 500 was underpriced heading into last week. That asymmetry, excessive put protection, underpriced upside, is exactly the type of positioning squeeze that produces face-ripping rallies. We saw one last week. There may be more ahead.
The third signal is our own Money Flow Breadth Ratio, or MFBR. When the MFBR drops below 30%, our 25-year backtest identifies a genuine capitulation washout. In those circumstances, the subsequent return profile flips dramatically: a positive outcome at one month 100% of the time, positive at six months, and a 100% win rate at twelve months. We're in that zone right now. That doesn't mean pain can't persist for another few weeks, but it does mean the odds strongly favor higher prices a year from today.
The Q1 Earnings Season Could Be The Catalyst
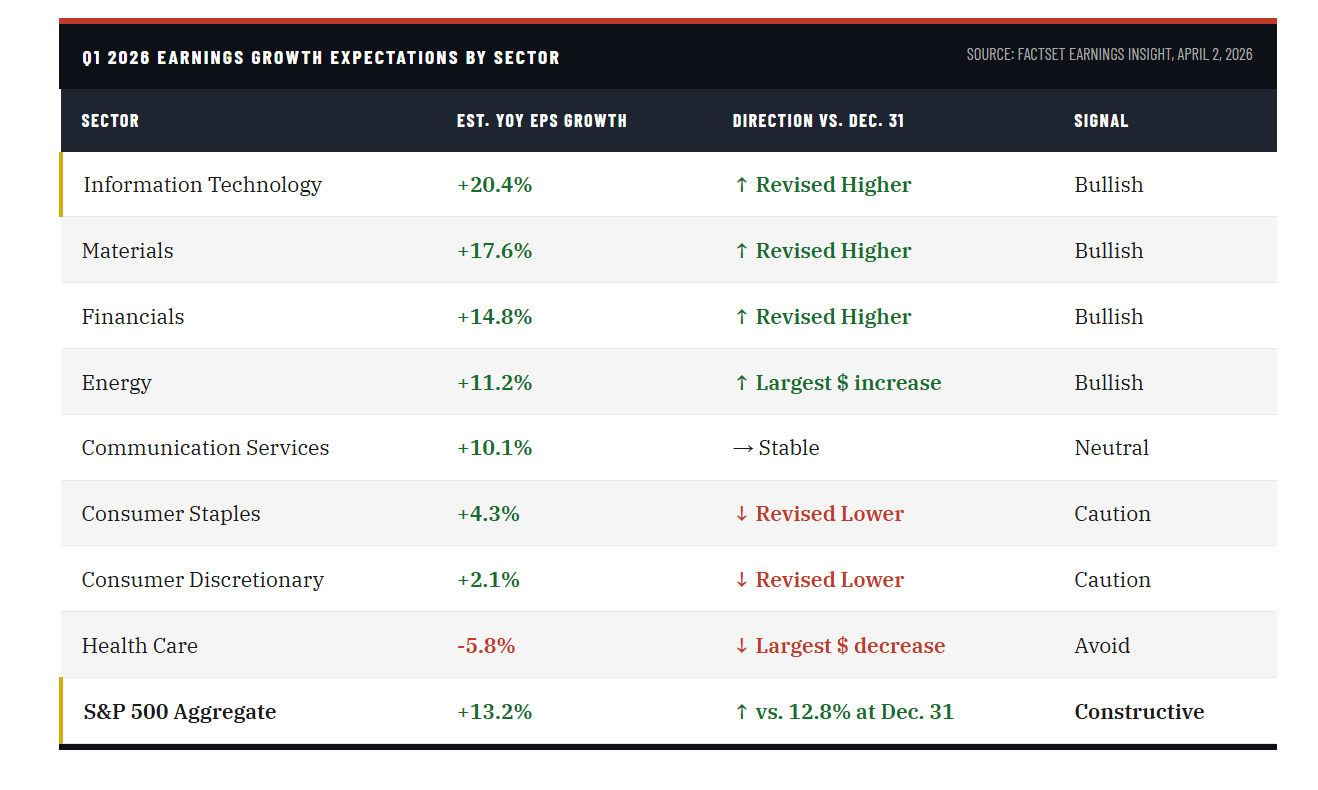
The Q1 earnings season will begin in earnest this coming week, with the major financials reporting starting with Goldman Sachs and JPMorgan. What's important to understand is that analysts have already trimmed estimates heading into the announcements. The bottom-up Q1 EPS estimate fell 0.3% during the quarter itself, versus a historical average decline of 1.6% to 4.2% over the past five to twenty years. In other words, the bar has been reset lower than it appears on the surface, which sets up a classic beat-and-raise scenario if corporate America can simply maintain its recent pace. FactSet estimates Q1 year-over-year earnings growth at 13.2%, up from the 12.8% expectation at the start of the year, with nine of eleven sectors projected to show positive growth. Barclays recently bumped its full-year 2026 S&P 500 EPS forecast to $321, projecting 15% to 16% annual growth.
The Q1 earnings season matters even more than usual right now because it provides a factual anchor in a market driven almost entirely by headline risk. Investors need something concrete to price. Strong numbers from JPMorgan, Bank of America, Netflix, and TSMC, the first major reporters, would confirm that corporate America is absorbing the oil shock and geopolitical uncertainty better than feared. That confirmation is the trigger that shifts money from the sidelines back into equities. Think of what happened in Q1 2003. When U.S. forces entered Iraq, the S&P 500 had already sold off aggressively on the uncertainty. Once the conflict began in earnest and earnings season confirmed business resilience, the index gained more than 25% in the following six months. The Q1 earnings season was the evidence the market needed that the macro fear had been overpriced.
Will that be the case this time? I don't know for certain, but when everyone is negative about everything, the market tends to find something to latch onto.
There's a valuation argument here that also deserves attention. The forward P/E on the S&P 500 stood at 22.0x on December 31. As of today, with prices down roughly 5% from the start of the year and earnings estimates rising modestly, that multiple has compressed to 19.8x, below the five-year average of 19.9x. That's not cheap by any historical standard, but it represents a genuine reset from the stretched valuations that made us cautious in January. With the Q1 earnings season potentially delivering another round of upward revisions, valuations could look even more reasonable by the time reporting wraps up.
The Risks That Could Still Derail Everything
I want to be honest about what could go wrong, because this market isn't out of the woods. The Iran ceasefire remains fragile. We've watched this pattern before: a burst of optimism on de-escalation language, followed by a return to hostilities that sends oil back toward recent highs near $111 a barrel. Every leg higher in crude acts like a slow tax on both corporate margins and consumer purchasing power. That's a direct headwind to the earnings beat cycle we need to see from the Q1 earnings season to validate higher prices.
"Ceasefires are fragile by definition… and we’ve already seen strikes overnight across the Gulf. You can hand-wave some of that as lag effects, but the disagreement around proxies (e.g. Lebanon with Israel) leaves plenty of scope for this to break. Ultimately though, the market will judge one thing… actual flows through the Strait over time. I struggle to see new highs for Equities, but positioning still argues for forced buying to run its course first. Europe in particular feels extended… a “fair” move might have been +2–3%, not +5%. From here, it’s all about triangulation… rates, credit, and oil. Rates matter most and are function of not just where oil goes, but where it settles. Credit will likely see aggressive covering as tail hedges decay… so less signal there in the near term. Vol compression ties it all together in determining fair spot." - Goldman Sachs
The Federal Reserve is also paralyzed in a way that markets haven't fully priced. With the CME FedWatch tool showing a 99.5% probability of no rate change at the April meeting, and zero-rate-cut expectations now extending through most of 2026, the policy backstop that investors have leaned on since 2020 isn't available. The 10-year Treasury closed near 4.36%, and CTAs have pushed their Treasury shorts to maximum levels, which in turn creates an overshoot risk that could send yields spiking further on any oil-related inflation surprise. When bonds and equities both sell off together, as we saw in March, there is nowhere to hide in a traditional portfolio.
So Is It Time To Add Exposure?
This isn't the environment to aggressively add exposure to risk. However, we can selectively add to our holdings heading into the Q1 earnings season. However, we are still maintaining a short leash in case things reverse quickly. The combination of a recaptured 200-day moving average, extreme bearish investor sentiment that has historically resolved higher, deeply depressed put-call ratios acting as coiled fuel for any upside surprise, a Q1 earnings season entering with a low bar and improving guidance, and valuations that have genuinely reset from their January extremes, that's a setup that demands action. Not reckless action. Measured action.
My recommendation is to add exposure selectively to sectors with the strongest earnings momentum: technology, financials, and healthcare, in that order. Use any geopolitical flare-up that tests the 200-DMA as a re-entry point rather than a reason to exit. If oil de-escalation holds and the Q1 earnings season delivers even close to the 13.2% growth FactSet is projecting, the path of least resistance for the second quarter is higher.
The traders who will get destroyed in this environment are the ones who fade every rally out of fear and chase every selloff into panic. The data says the extreme pessimism of March was a buying signal. The Q1 earnings season is the catalyst that will prove or disprove it.
We will continue to watch the data closely and trade accordingly.
🖊️ From Lance’s Desk
This week's #MacroView blog is part two of a two-part series on oil shocks, the economic impacts, and the Federal Reserve's response problem.
Also Posted This Week:
- The Apple AI Strategy: Discipline Over Hype - RIA - by Michael Lebowitz
- The Stock Market Rally: Buy Or Fade It? - RIA - by Lance Roberts
📹 Watch & Listen
Michael Lebowitz discusses the struggle between the stock market and oil prices as a tenuous ceasefire proceeds in the US/Iran conflict.
Subscribe To Our YouTube Channel To Get Notified Of All Our Videos

📊 Market Statistics & Analysis
Weekly technical overview across key sectors, risk indicators, and market internals will return next week.
Have a great week.
Lance Roberts, CIO, RIA Advisors
The post Q1 Earnings Season: Buy Or Fade The Rally? appeared first on RIA.
Full story here Are you the author?You Might Also Like
2026-03-07
🔎 At a Glance Give Us A Review ***** If you enjoy our work each week, could you be so kind as to leave us a review? It would be most appreciated. 🏛️ Market Brief – Markets Navigate Military Conflict It was a brutal week on Wall Street. The S&P 500 finished at its lowest close …
 The Financial Sector Is Under Pressure
2026-03-03
The heatmap below, courtesy of FinViz, shows the one-month performance of the S&P 500 financial sector stocks. As shown, Berkshire Hathaway and the insurance companies are higher over the period, while the large majority of the remaining financial sector stocks struggle. For context, the S&P 500 was down 2.80% over the same period. There appear …
 2026 Economic Summit Recap: Where Investing, AI, and Digital Assets Converged
2026-01-28
The 2026 Economic Summit brought together forward-thinking investors, advisors, and industry leaders for two days of timely insights, candid conversations, and actionable takeaways on the future of money, markets, and technology. A Strong Start: VIP Pre-Event Mixer The event kicked off on Friday evening, January 16, with an intimate VIP Pre-Event Mixer. Attendees from all …
 Is Japan In A Death Spiral?: A Contrarian Take
2025-12-09
A day doesn’t seem to go by without a market pundit asserting that Japan is in a monetary and fiscal death spiral. It’s easy to come to such a conclusion given: Based on those stats and others, it’s easy to see why many think it’s only a matter of time before Japan’s economic system collapses. …
Tags: Featured,newsletter


