


Gated funds, collateral fraud, and auto-sector defaults are giving investors in private credit funds and their stock-market equivalents, business development corporations (BDCs), a headache.
We have discussed the recent woes of private credit funds (HERE, HERE, HERE), yet we haven't addressed BDCs. The similarities and differences between private credit funds and BDCs are important. For instance, the bad press about the widespread gating of private credit funds. While BDCs own similar assets, they trade on a stock exchange. Thus, investors who want to sell don’t have to rely on a fund manager's whim; they can sell their shares in seconds.
The poor sentiment toward private credit funds has dragged down many high-quality BDCs, as well as weaker ones. The chaos and bad press surrounding private credit funds are not reasons to avoid BDCs. In fact, we think it’s a reason to consider it.
What Is a BDC?
Congress passed the Small Business Investment Incentive Act of 1980 to provide capital to small- and mid-sized private businesses that lacked access to public credit and equity markets. Per Congressional records, BDCs:
Encourage the mobilization of capital for new, small and medium-sized and independent businesses.
BDCs, like private credit funds, are professionally managed portfolios of private loans, but unlike private credit funds, they trade on a stock exchange. Some BDCs also hold equity in the companies they lend to.
The BDC structure is similar to that of Real Estate Investment Trusts (REITs) in that BDCs must distribute at least 90% of their taxable income to shareholders. This partially explains why they tend to have above-average dividend yields.

Liquidity
As we led this article, liquidity is a key difference between a BDC and a private credit fund. The headlines about private credit fund investors being unable to redeem their investments stem from a liquidity mismatch. The funds made loans for three or more years, but promised investors they could get their money back quarterly. When redemption requests exceed the fund's liquidity, the fund must limit, or gate, redemptions. BDC investors don't face that problem. Shares are never redeemed, just traded from one investor to another.
However, there is a cost for liquidity. BDC investors face price volatility. Because the stock price trades daily while the underlying portfolio’s value (NAV) is released only quarterly, BDCs' stock prices are highly sensitive to positive or negative sentiment and NAV forecasts.
Private credit fund investors only see their price (NAV) change quarterly; the volatility is hidden, not absent. BDC investors see volatility in real time, which is uncomfortable, but it also creates opportunities.
The graph below, courtesy of VanEck, shows that the return profiles of BDCs and Private Credit Funds are similar, albeit BDCs exhibit more volatility. Again, the volatility you don’t see in private credit can be more problematic than the volatility you see with BDCs.

Net Asset Value (NAV)
When evaluating a BDC, the most important consideration is the NAV per share. NAV/share represents the estimated fair value of all loans and equity investments in the portfolio, minus liabilities, divided by the number of shares outstanding. It's like the price-to-book ratio valuation.
When a BDC trades at a discount to its NAV, the market is effectively worried about one of two things:
- It doesn't trust the stated NAV
- It believes the portfolio’s value has deteriorated from the last reported NAV.
When a BDC trades at a premium to NAV, it may be because investors think the real NAV has appreciated since it was last reported. Or investors are paying up for something they believe is worth more than the sum of its parts. This may include a manager with a proven track record of consistent NAV growth, conservative underwriting standards, cost advantages, and structural advantages that competitors lack.
Currently, the private credit selloff has pushed many BDCs to meaningful discounts. Some may be warranted if their NAVs have fallen; others may not. Determining which requires understanding the contents of the BDC portfolios and how they are managed.
Internal Or External Management
An important differentiator of BDCs is whether the portfolio manager is internal or external.
The vast majority of BDCs are externally managed. In these cases, an outside firm manages the portfolio and charges fees to the funds. Typically, this includes an annual management fee of around 1.50% of total assets, plus an incentive bonus of roughly 15-20% of income above a hurdle rate. Those fees are paid before an investor receives a dime of dividends.
The payment structure creates a so-called principal-agent problem. Shareholders want the manager to maximize risk-adjusted returns. However, the manager is paid the most when they maximize assets under management. Those two objectives are not the same. Managers are incentivized to deploy capital even when the best opportunities aren't available. They can compromise on credit quality, reach for yield in riskier loans, and leverage the portfolio to make marginal loans look attractive.
Internally managed BDCs avoid fees and the principal-agent problem. Internal portfolio managers' interests closely align with those of shareholders because they are the same entity. The cost advantage of not paying fees compounds over time, and the incentive structure rewards making good loans rather than making more loans.
Internally managed BDCs are rare, which is one reason the best performing ones may trade at a premium to their NAV.

Portfolio Composition
When evaluating a BDC, the industry breakdown of its loan book is an important assessment. That is especially true today, when estimates suggest that BDCs and private credit funds have made over a quarter of their loans to software companies.
Recurring-revenue Software as a Service (SaaS) models were among the favorites of direct lenders when interest rates were low. Those companies with strong income statements are now being squeezed by higher borrowing costs and AI disruption narratives that have called business models into question. When software valuations fall, the collateral underpinning those loans shrinks.
BDCs that lend to businesses in industries such as construction, healthcare, food services, and manufacturing carry materially less of the specific risk that is weighing heavily on software companies today.
Capital Structure
Beyond industry exposure, investors should understand capital structure positioning. BDCs make first lien and subordinated loans. First-lien debt is secured by assets and paid to first-lien holders before other creditors in the event of a default. Second-lien and subordinated debt are paid after all first lien obligations have been met. In a weakening credit environment, the position in the capital structure can make a huge difference in how much principal is returned.
PIK Income
Another consideration is Payment-in-Kind (PIK) income as a percentage of total income. PIK stands for payment-in-kind. This structure allows a borrower who can't pay cash interest to issue more debt to cover the shortfall. A rising PIK-to-total income ratio is an early warning sign that a BDC’s borrowers are struggling.
Leverage and Dividend Coverage
BDCs are permitted to leverage up to 2:1 debt-to-equity. Most are managed at a 1:1 to 1.5:1 ratio. Higher leverage increases both income and losses. Leverage makes the BDC look more attractive in calm markets and riskier when credit conditions tighten.
Many investors focus on the dividend yields but not the dividend coverage. The coverage, or how much they earn relative to the dividend, is critical to assessing the probability that the BDC can make current dividend payments going forward. A coverage ratio above 100% means the BDC earns more than it distributes. Below 100% indicates the shortfall is being funded by the return of capital, meaning investors are gradually receiving their own money back.

Analyzing Two BDCs
To further your knowledge of BDCs, we thought it would be helpful to conduct a quick analysis of two BDCs and illustrate some of the factors we look at in BDC investments. In this example, we compare internally and externally managed BDCs.
As a disclaimer, our clients own both BDCs discussed below.
Blackstone Secured Lending Fund (BXSL)- Per Blackstone:
Launched in 2018, BXSL is a business development company focused on first lien senior secured opportunities that offer structural protection. As part of Blackstone Credit & Insurance, BXSL benefits from the scale, deep relationships, market insights, and operational expertise of one of the world’s leading credit platforms.
Main Street Capital (MAIN)- Per Main ST Capital Corporation:
Main Street is a principal investment firm that primarily provides customized long-term debt and equity capital solutions to lower middle market companies and debt capital to private companies owned by or in the process of being acquired by a private equity fund. Main Street's portfolio investments are typically made to support management buyouts, recapitalizations, growth financings, refinancings and acquisitions of companies that operate in diverse industry sectors.
The following table shares a few of the factors we use to assess BDCs.
- NAV: BXSL trades at a discount while MAIN trades at a significant premium. That largely explains the difference in dividend yields between the two.
- Net Interest Income (NII): Both stocks should be able to sufficiently maintain their dividends for the time being.
- Non-Accrual: This measures the percentage of loan balances for which borrowers have stopped making interest or principal payments, typically for 90 days or more. Both BDCs have extremely low non-accrual rates.
- Net Debt/Equity: BSXL has a ratio of 1.22x, implying that the fund is funding its loans with $1.22 of debt for every $1.00 of equity. This equates to a capital structure that is 55% debt and 45% equity. Conversely, MAIN uses less leverage, with a capital structure of 47% debt and 53% equity.
- First Lien and Software Exposure: Both help us measure the credit quality of the underlying loans.
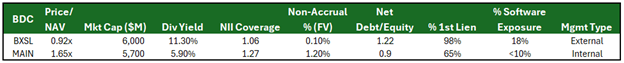
BXSL has slightly better credit quality but uses external management. MAIN has a great track record and internal management, but a lower yield due to its high premium to its NAV.
Summary
BDCs are not private credit funds. That distinction is easy to overlook when headlines lump the two together. Yet that is what makes BDCs an interesting investment option.
Negative sentiment toward private credit has pushed many BDCs to discounts that don't fully reflect the quality of the underlying portfolios. However, not every BDC that is trading at a discount to NAV is an opportunity. Some are cheap for good reasons, such as heavy software exposure, external managers with misaligned incentives, rising PIK ratios, thin dividend coverage, and high leverage. Other BDCs have been caught in the same downdraft despite strong credit quality, conservative leverage, and disciplined underwriting.
The post BDCs: Not All Yield Is Created Equal appeared first on RIA.
Full story here Are you the author?You Might Also Like
2026-04-02
Volume profiling provides unique insight into the profit-and-loss position of recent investors by identifying price levels at which significant buying and selling have occurred. Areas of high volume can act as powerful support and resistance levels because they represent prices at which a large number of investors have established positions and are therefore likely to …
 Beta: A Powerful But Faulty Tool For Managing Risk
2026-04-01
When investors want to reduce risk, one commonly used tool is beta. For instance, an investor may sell higher-beta stocks and replace them with lower-beta ones to cushion against an expected market decline. Such a strategy is intuitive and widely used; however, it can be greatly flawed. We recently received a question from a client …
 BLS Labor Report Defies Consensus
2026-02-12
The delayed BLS employment report came in well above expectations, showing the economy added 130k jobs in January. Furthermore, the unemployment rate slipped to 4.3% versus expectations of a 0.1% increase to 4.5%. The more encompassing U6 unemployment rate fell from 8.4% to 8.0%. The BLS labor report contradicts the monthly and weekly ADP reports, …
 Electricity Prices Could Become a Structural Inflation Problem
2025-12-30
Most Americans are paying higher electricity prices, and the pressure is unlikely to ease anytime soon. According to the Wall Street Journal, electricity prices have risen meaningfully across much of the country since 2022, and the drivers extend well beyond the frequently cited surge in data-center demand. While electricity prices had historically tracked inflation, that …
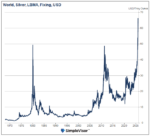 Silver Mania And The Predictable Bust
2025-12-23
Silver’s parabolic rise has been remarkable. Its price has more than doubled this year and is nearly three times higher than in 2023. The current surge closely mirrors two previous price jumps shown below. In this article, we examine the two similar price surges shown below to provide context for what may be occurring today …
Tags: Featured,newsletter


