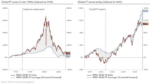
In our February 3rd Commentary, we discussed the recent woes negatively impacting private credit funds. The concerns began last year with the bankruptcies of Tricolor and First Brands and continue to mount, as evidenced by the share prices of some private credit managers shown below. Adding to market worries is fresh news of a $1.3 billion shortfall at private credit investor Market Financial Solutions (MFS).
MFS creditors allege that as much as £1.2 billion in loans were backed by only £230 million of “true value” collateral. In healthy asset-based lending, collateral typically exceeds loan value by up to 20%. Allegations are that MFS was double pledging collateral, i.e., using the same collateral for different loans.
In an environment such as the one we have been in, where banks, direct lenders, and investors compete aggressively for yield, prudence is often an afterthought. Whether losses for MFS ultimately prove catastrophic or manageable, the episode reinforces an important lesson: liquidity can mask risk for long periods, but once confidence in collateral is questioned, leverage works in reverse with astonishing speed.
It's worth noting that, as investors grow antsy about the situation with direct lenders, credit spreads are slowly widening, driving a bid for risk-free US Treasuries.

What To Watch Today
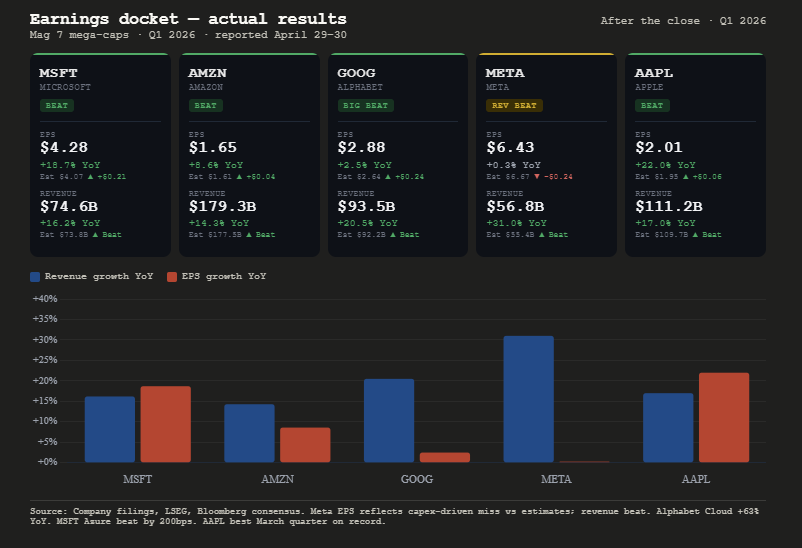
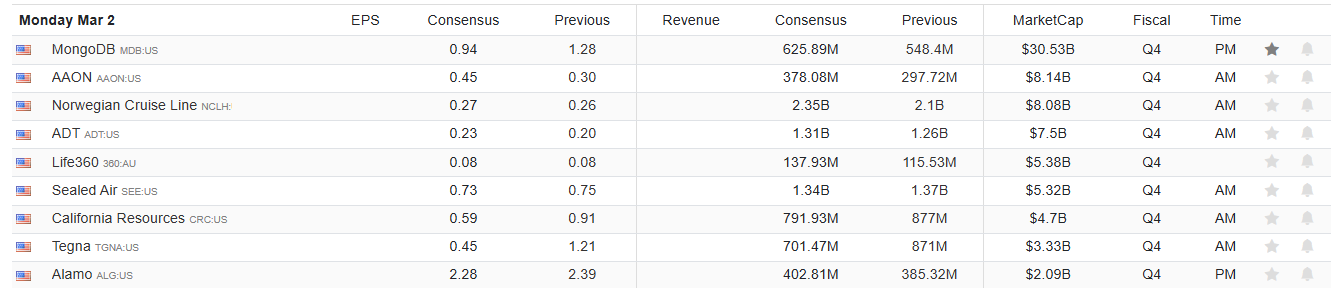
Earnings
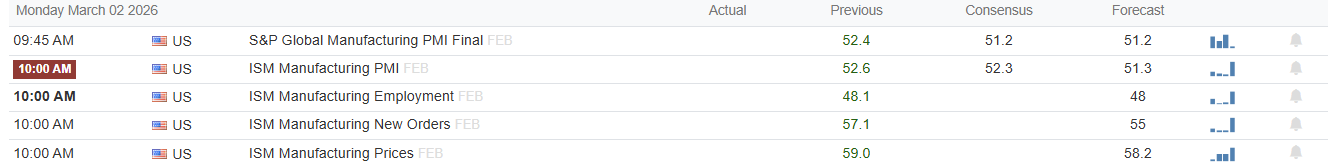
Economy
Market Trading Update
The S&P 500 closed Friday at 6,878, marking a second consecutive down session. From a pure trend perspective, the market remains in a bullish primary uptrend but is now clearly struggling within the February consolidation range. The index sits below both its 20-DMA (~6,896) and 50-DMA (~6,899), which have crossed and are now acting as overhead resistance rather than support. Every rally attempt in February has stalled in the 6,950–7,000 zone, while every pullback has found buyers near the 100-DMA and the lower consolidation range around 6,831.

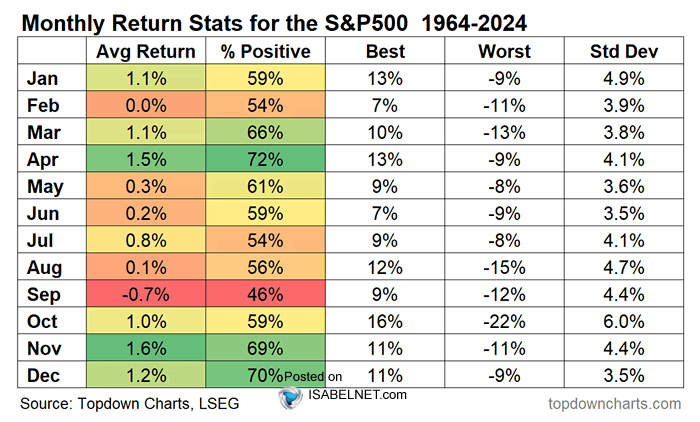
Heading into March, seasonal data provides a positive tailwind. Since 1964, the S&P 500 has posted an average price return of approximately +1.1% during March, making it one of the better-performing calendar months. March falls within the traditionally favorable “best six months” window (November through April), which has historically outperformed the May–October stretch.
However, there is a critical asterisk: 2026 is a midterm election year. Midterm years carry a well-documented pattern of elevated volatility and muted returns during the first half of the calendar year. According to data compiled by the Motley Fool, the S&P 500 has returned an average of just +1% during midterm election years and has historically suffered an average intra-year drawdown of roughly 18%. When a new president takes office, as is the case now, the average midterm-year return drops to approximately ~7%. Capital Group’s analysis, going back to 1931, further shows that the first several months of midterm election years typically deliver sub-par returns, with markets often gaining little ground until shortly before the November midterm elections.
Bottom line:
With respect to the overall market, momentum indicators are deteriorating on the short-term time frame but remain supportive on the intermediate-to-long-term basis. The 14-day RSI stands at approximately 48, firmly neutral territory and well off the elevated readings above 65 seen in late January when the index was testing 7,000. The RSI is not yet oversold (below 30), which means the index has room to drift lower before reaching levels that have historically attracted aggressive dip-buying. As discussed in more detail below, the market is flirting with the bottom of its recent consolidation range and the 100-day moving average, where a break lower could draw more selling.
The bull trend is intact, but the “easy money” phase appears to be mature. The intermediate-to-long-term structure remains constructive, the 200-DMA is rising, breadth is near record levels, and the rotation trade is broadening participation. However, short-term momentum has deteriorated notably: the index is below both its 20- and 50-DMAs, the MACD has crossed bearishly, the RSI is declining, and the VIX is trending higher. Layer in the midterm election year seasonal headwinds, hotter-than-expected inflation, and Iran-related geopolitical risk, and the path of least resistance in early March tilts toward further consolidation or a modest pullback before the seasonal tailwinds attempt to reassert themselves. I suspect we will get a better entry point for a rally as we move into March. However, use that opportunity to rebalance oversized winners, define risk levels, and avoid chasing strength. Don’t fight the trend, but protect gains if volatility inevitably returns.
| Level Type | Price Zone | Technical Significance |
| Immediate Resistance | 6,950 – 7,000 | Psychological round-number resistance. Repeated failures in this range during the February consolidation. |
| Secondary Resistance | 7,100 – 7,206 | First extension target above the range; aligns with BofA’s technical objective. |
| Initial Resistance | 6,896 – 6,900 | 50-DMA (~6,899) and 20-DMA (~6,896). Must reclaim these to reassert short-term bullish control. |
| Intermediate Support | 6,750 – 6,800 | Bottom of the consolidation range. BofA primary trendline support at 6,750. |
| Major Support | 6,550 | 200-DMA. A breakdown to this level would signal a more meaningful trend deterioration. |

The Week Ahead
It should be a relatively quiet week with most fourth-quarter earnings reports out of the way and little economic data until Friday. On Friday, the BLS will release the February jobs report. The market is only expecting growth of 65k jobs despite last months suprising 130k addition. The weekly ADP reports argue the true number of new jobs in the aggregate is close to the 65k consensus, not last month's report. Retail sales for January are also due on Friday. Wall Street is expecting +0.1% increase. Considering inflation is running close to 2.5% annually, that equates to negative real growth.
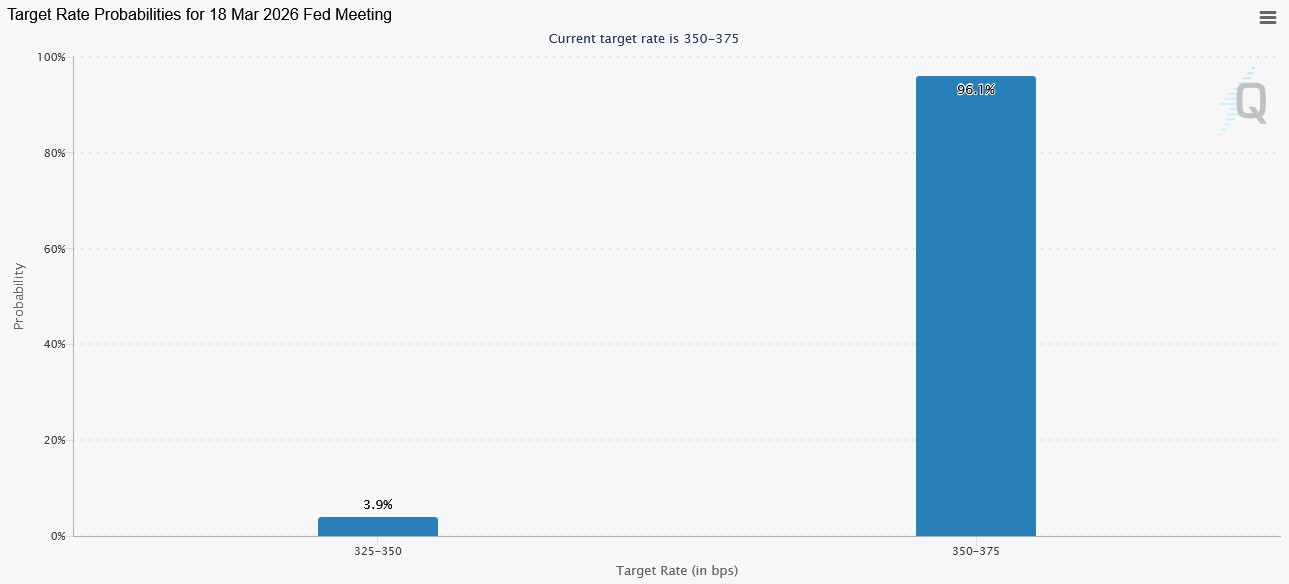
The FOMC doesn't meet again until March 18th. Currently, expectations for a rate cut are low, as shown below. However, a new round of CPI data next week and this week's employment report could impact those odds.
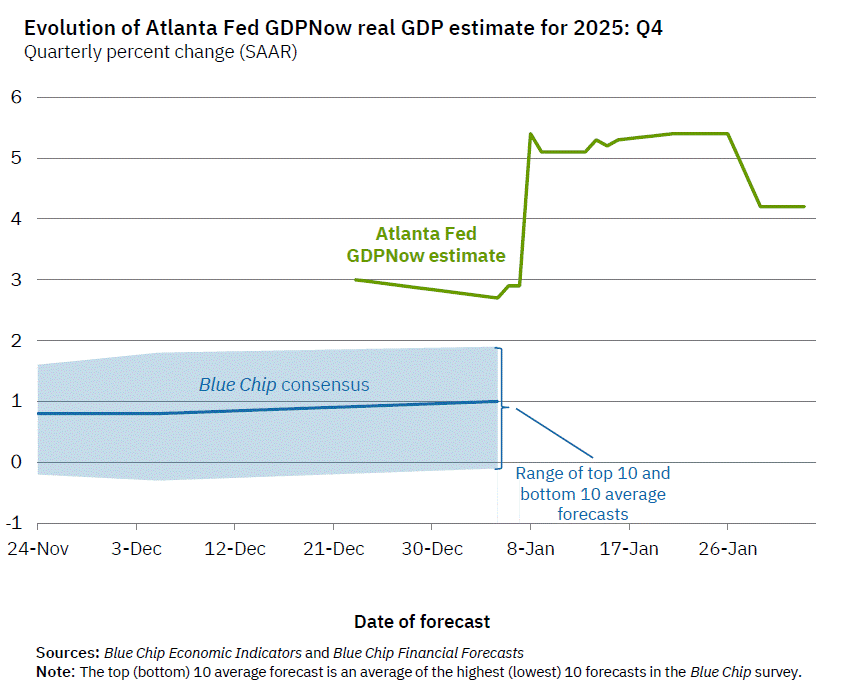
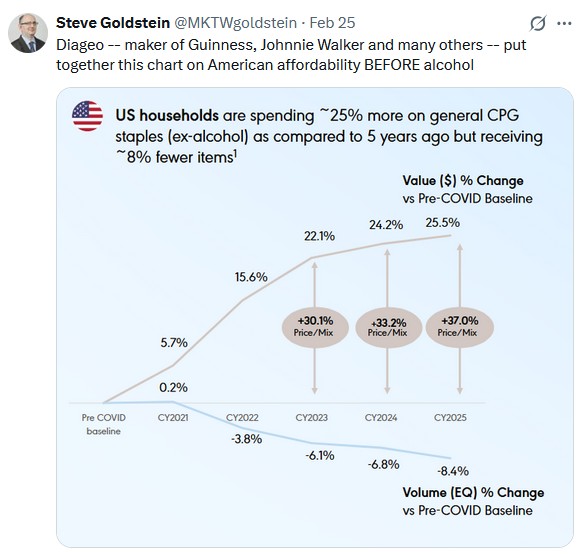
Economic Sentiment Belies Strong Economic Estimates
Economic growth metrics for the United States have recently shown surprising resilience; however, consumers’ economic sentiment has not. According to the Atlanta Federal Reserve, real Gross Domestic Product is estimated to have expanded at an annualized rate of 4.2% in the fourth quarter of 2025, exceeding expectations and marking some of the strongest growth in the past two years. Growth was driven by firm consumer spending, stronger exports, and increased government outlays. Consumer expenditures rose 3.5 percent, the fastest pace of the year. These figures suggest a macroeconomy in expansion.
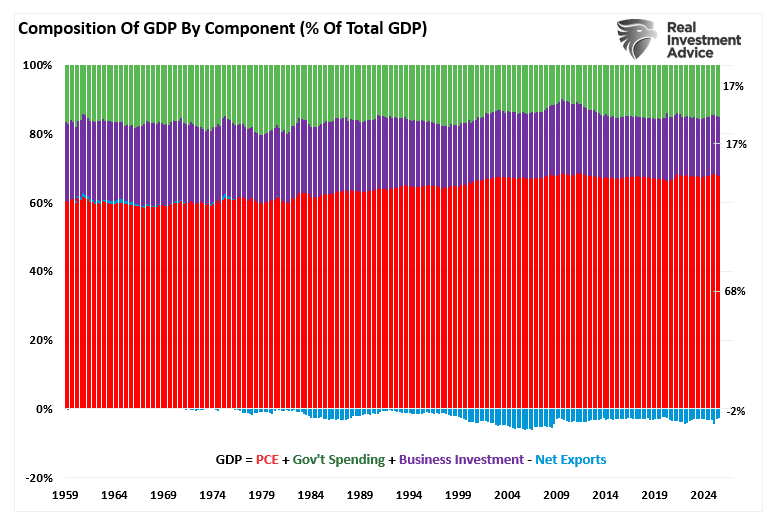
Notably, Gross Domestic Product (GDP) measures the total output of goods and services in the U.S. Of that total, personal consumption expenditures (PCE) comprise roughly 68%. In other words, so goes the consumer, so goes the economy.
When GDP climbs, it signals more economic activity (i.e., consumer demand), which then fuels broader expansion of production. Naturally, GDP growth rates are closely monitored by policymakers, investors, and corporate planners. There is much interpretation of GDP growth as evidence of potential for higher sales and profits going forward, but it does not tell the full story of individual households’ financial experiences.
Tweet of the Day
“Want to achieve better long-term success in managing your portfolio? Here are our 15-trading rules for managing market risks.”
Please subscribe to the daily commentary to receive these updates every morning before the opening bell.
If you found this blog useful, please send it to someone else, share it on social media, or contact us to set up a meeting.
The post MFS Collapses Adding To Private Credit Woes appeared first on RIA.
Full story here Are you the author?You Might Also Like
 Hindenburg Alarm: Another Rotation Or Worse?
2026-02-26
In early November, we sounded the alarm about a recent Hindenburg Omen. Per the Commentary’s summary: Bottom line: market breadth is horrendous and will likely lead to a rotation favoring out-of-favor sectors and stocks. Thus, it’s not surprising that the Hindenburg Omen was triggered. If we continue to see more of these Omens, the threat …
 A No Landing Outcome Is Assumed: Should It Be?
2026-02-19
Quite often, investors describe economic forecasts as a hard landing (recession), a soft landing (weak growth but no recession), or no landing (moderate to strong economic growth). As evidenced by the massive rotation toward economically sensitive sectors like industrials and materials and the significant underperformance of interest-rate-sensitive growth stocks, the no landing, or as it’s …
 “Money Printing” By The Fed: Fact Or Fiction?
2025-11-07
I recently penned an article on “Money Supply Growth,” which elicited a very thoughtful response from Garrett Baldwin via Substack. He argued that labeling Federal Reserve operations as “money printing” is not rhetoric, but rather a reality. He points to Ben Bernanke’s 2010 interview, where Bernanke described how the Fed marks up digital accounts. But …
Tags: Featured,newsletter