Record deficit spending, soaring money supply, and inflation are among the likely responses we would hear from investors to the question of why gold is surging. Instead of presuming those or other market narratives about gold prices are correct, let’s analyze historical correlations between gold and economic and market data.
In addition to helping you better appreciate why gold is surging, our analysis will help you recognize that market narratives explaining asset price movements can be wrong, no matter how reasonable they may seem at first blush.
What Is Gold?
Gold is neither a claim on the promise of future earnings like a stock nor a liability owed by a public institution or a private party like a bond. Unlike currency, it lacks the full faith and credit of most governments.
Gold serves few industrial purposes, unlike all other commodities, and is most revered as a shiny metal used for display or jewelry. It is precisely these facts that make gold a unique asset. Moreover, some investors consider gold a store of value and an invaluable diversifying component of a portfolio.
To some, gold is a time-honored currency. In the words of John Pierpont Morgan (J.P. Morgan):
Gold is money, everything else is credit
Fed Chairman Alan Greenspan defines it as follows:
“Gold, unlike all other commodities is a currency… and the major thrust in the demand for gold is not for jewelry. It is not for anything other than an escape from what is perceived to be a fiat money system, paper money that seems to be deteriorating.” -Alan Greenspan 2011

Shorter Term- M2, CPI, Real Rates, and the Dollar vs. Gold Prices
We start our analysis with a recent view to assess which factor(s) have had the most robust relationship with gold over the last few years.
The graph below shows the running one-year correlation of gold to M2 (money supply), CPI, 10-year Real Rates, and the U.S. dollar index since 2020. As shown, the correlation for each factor varies over the four years. Here are a few takeaways:
- Except for 2023, gold had a positive correlation with M2. Interestingly, as M2 shrank in 2023, the relationship became negative. Against conventional wisdom, gold rose as M2 fell.
- Gold and the dollar index have had a negative correlation for most of the entire period. The dollar index recently hit support at $1.00. If support holds such, it may portend weaker gold prices and vice versa if it breaks support.
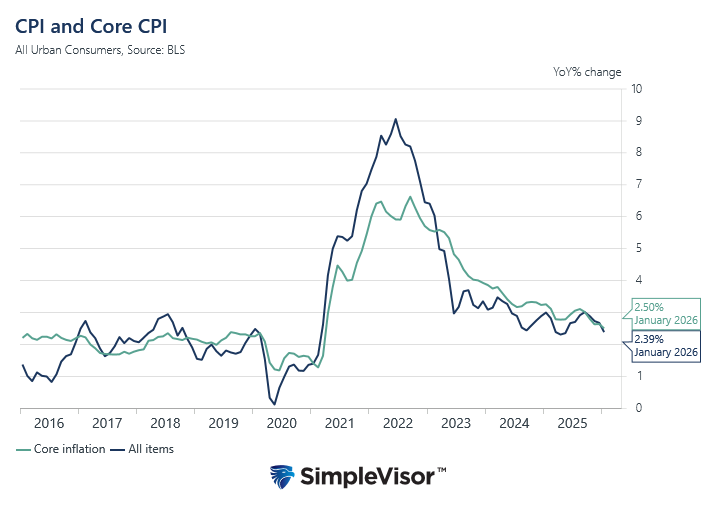
- Other than 2021, the relationship between gold and inflation has been negative. Despite sharply rising inflation, gold was unchanged in 2021. The relationship has become strongly negatively correlated recently as gold prices are rising while inflation is falling. Similar to our comments regarding M2, recent correlations between CPI and gold do not correspond with the narratives supporting surging gold prices.
- The relationship between Ten-year real rates and gold has oscillated over the period, albeit it has primarily been negative. Lower real rates have coincided with higher gold prices. This relationship is often negative but much more potent when real rates are closer to zero.

Longer Term- M2, CPI, Real Rates, and the Dollar vs. Gold Prices
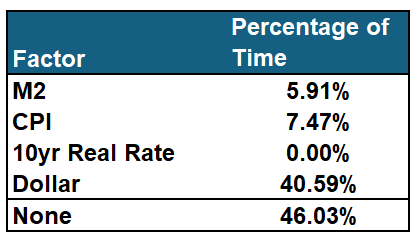
The analysis below is based on the running one-year correlation between gold and each economic factor. The graphs and tables show the most dominant factor for each month since 1971.
We set a correlation of +/- 0.40 as our minimum to appear in the graph. If the correlation of gold to any of the factors was above +0.40 or below -0.40, we show the factor with the highest or lowest correlation to gold. If all of the correlations are between -0.40 and +0.40, we deem that the period is not well correlated to any of the factors. Furthermore, we separate the positive and negative correlation scores to help better view the results. Lastly, we summarize the results in a table below each graph.


As the graphs show, the factor with the most robust relationship varies over time. The dollar and gold seem to have the most predominant negative relationship, while the dollar and M2 have the most frequent positive relationship.
The critical takeaway is that different factors have a strong relationship with gold at various times. Furthermore, there are many periods when none of the factors strongly correlate with gold. If you are trading gold based on one of the relationships, it’s best to assess the recent strength of the relationship.

Gold And Stocks
Gold and the stock market, using the S&P 500, have no meaningful long-term relationship. However, as we show below, they go through periods of significant positive and negative relationships.
Over the shorter 3-month periods, the correlation can exceed +/-0.75, considered statistically significant. The correlation over the last three months is +0.49.

Gold and Bitcoin
Many people buy Bitcoin for similar reasons to gold. Simply, it is considered by many to be an alternative currency that, in theory, should protect the buyer against the debasing of the U.S. dollar. Because Bitcoin has only been around for about ten years, we calculate the correlation between it and gold on a shorter three-month rolling time frame. As shown, the correlation is volatile with no dominant relationship.

Multiple Regression Analysis- The Case For Real Rates
Based on the data, gold tends to have more reliable relationships with economic data than market data. Therefore, we take the analysis of the four economic factors a step further and run a multiple regression analysis. Doing so calculates the correlation of the four factors combined instead of individually. Furthermore, the analysis informs us of the relevance of each factor regarding its impact on the price of gold.
We broke the multiple regression into two periods, 1971-2007 and 2008-current. This method separates the eras when the Fed used QE and didn’t. Despite the time division, both analyses were similar.
The correlation coefficient was .23 for the QE era and .19 for the pre-QE era. Both are considered statistically weak. However, the t-statistics, measuring the relevance of each factor, highlight real rates as the most crucial factor driving gold prices. A t-stat of 2.0 or greater is considered statistically significant. The t-statistics for real rates were 3.25 and 3.75 for the post and pre-QE eras, respectively.
The multiple regression aligns with our prior analysis of gold. For more on the relationship and its meaning, please read our article – Gold Investors Are Betting On The Fed.

Current Situation
The recent bubble-like speculative activity occurring in many asset markets and the strong correlation between stocks and gold lead us to believe gold appears to be part of the everything bubble. Inflation is falling, M2 growth is flat, and real rates are high. Based on historical relationships, such an environment should not be conducive to higher gold prices. Moreover, tight monetary policy by the Fed is prudent, which should not bode well for gold.
So, Why Is Gold Surging?
Given that gold is running counter to its normal relationships with key fundamental factors, we are left with its positive correlation with the stock market to explain its recent price trend. As seen in many other assets, speculative fever in gold appears to answer our question.
The speculative atmosphere can continue, but beware because gold is getting overbought and deviating from its long-term fundamental drivers. When speculative momentum fails, gold may eventually catch down to its fundamental relationships.
The following is from our article The Everything Market Could Last A While Longer:
On the other side of the bull/bear argument are “gold bugs” enjoying soaring gold prices because “debts and deficits” are finally eroding the U.S. economy. As Michael Hartnet of BofA recently stated:
“Long-run returns in commodities are rising after the worst decade since the 1930s, led by gold, which is a hedge against the 3Ds: debt, deficit, debasement.”
The evidence doesn’t support that view. Historically, when deficits as a percentage of GDP increase, gold does very well as concerns about U.S. economic health increase (as per Michael Hartnett of BofA.)However, gold performs poorly as economic growth resumes and the deficit declines. Such is logical, except that since 2020, gold has soared in price even as economic health remains robust and the deficit as a percentage of GDP continues to decline.
Summary
The key to effectively trading gold is knowing which factor(s) currently has the most robust relationship with gold prices. As we share, the importance of each factor varies over time. Moreover, short-term speculative environments driving this gold surge, as we believe we are currently in, can sever fundamental relationships that are more dependable over extended periods.
Like any speculative asset, awareness of price trends, momentum, and the underlying fundamentals is critical to better evaluating how gold may trade.
The post Why Is Gold Surging? appeared first on RIA.
Full story here Are you the author? Previous post See more for Next postTags: Featured,Investing,newsletter


