Well, they did it. The Fed cut the Fed Funds rate by 50 basis points last week and indicated that there is likely more to come. Stock investors liked it, bidding up small cap stocks (S&P 600) by 2.25%, large caps (S&P 500) by 1.4% and the NASDAQ by 1.5%. Most other markets also did as expected with emerging market stocks up 2% – led by China for a change which was up nearly 5% – Gold up 1.5% and general commodities up almost 3%. But there was one area of the market that didn’t act as expected and that’s the one we probably ought to focus on.
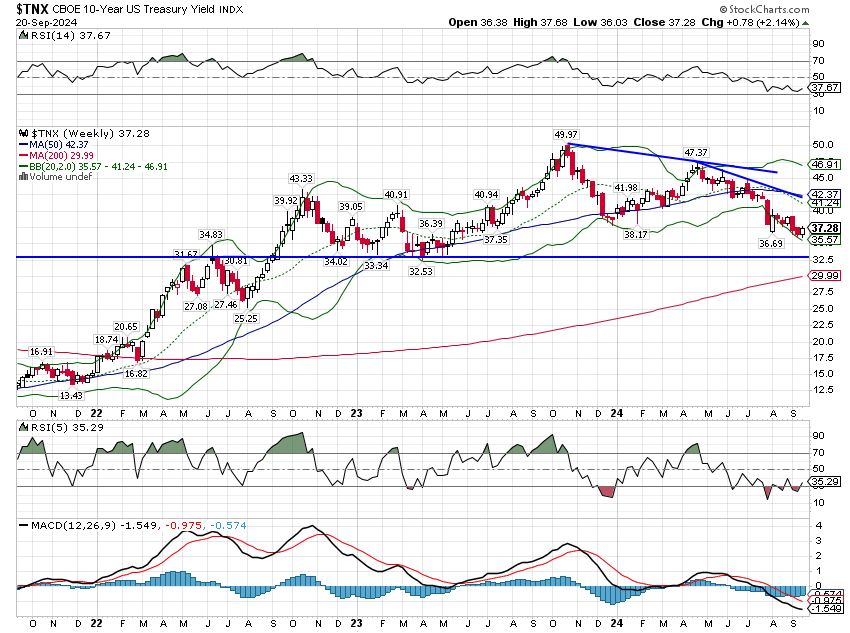
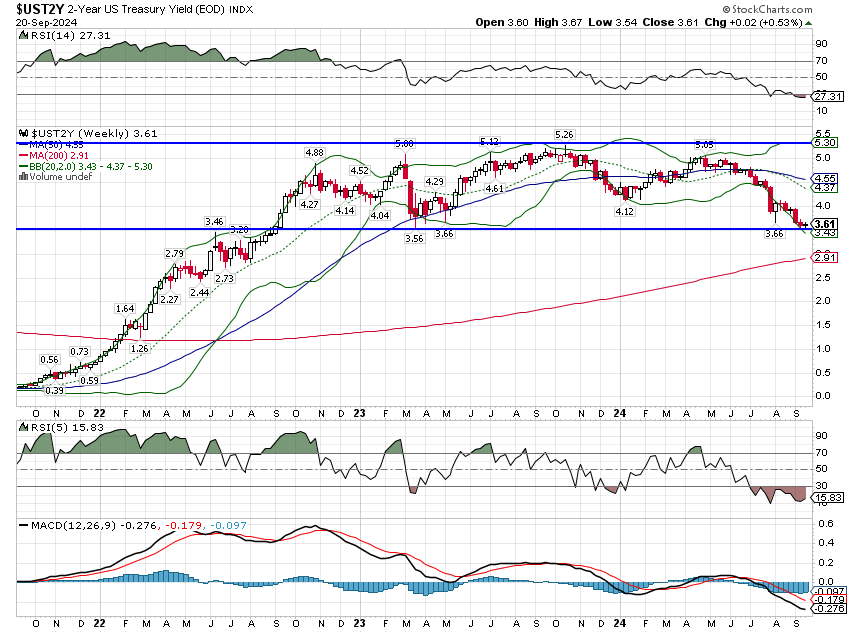
The 10 year bond yield rose 8 basis points last week which isn’t a lot and probably doesn’t mean that much but it was in the “wrong” direction, especially considering the Fed expects to cut more over the next year. Meanwhile, 10 year TIPS yields were flat on the week which means that inflation expectations rose modestly, which is certainly not what the Fed wanted. The 2 year yield was also flat on the week so the 10/2 term spread steepened. That is known in the business as a bear steepener and it isn’t what one would expect if we were on the verge of recession. Of course, it was only one week and most of the recent steepening has been of the bull variety which is the normal response before recession. The question that will be answered in coming weeks is whether the Fed’s action last week changed the narrative from fear of recession back to a fear of inflation.
There is little in the economic data right now that points to much of a slowdown and inflation is not yet back to the Fed’s stated target but the Fed chose to act aggressively anyway. If you believe the Fed has a large impact on the economy you might start to worry that they’ve made a mistake. (I don’t happen to think that way but markets move based on the majority’s opinion not that of a lone, cynical investment advisor.) Powell took pains to say at his press conference that this is about acting pre-emptively and I suppose that’s a good thing but I don’t have nearly the same level of confidence Powell & Co. apparently do that inflation will continue to ebb. Mortgage rates are down from 7.3% a year ago to 6.1% today and mortgage applications are already rising, particularly refinancing applications. If rates stay down here – or fall more – I would expect housing activity to start picking up as well. That is not going to slow NGDP (nominal GDP) growth, which is what is likely needed to get inflation durably back to 2% or less.
The year over year change in NGDP is currently 5.9% which consists of 3.1% real growth and 2.8% inflation. With the Atlanta Fed’s GDPNow currently showing 2.9% real growth for Q3 and the year over year change in inflation at 2.6%, NGDP may slow this quarter but only to about 5.5%. All the data for the quarter isn’t in yet so the final Q3 reading on GDP could be worse, but current conditions do not scream “big rate cut”. For the Fed’s cut last week to make sense, the growth in NGDP is going to have to slow more than that unless you assume that potential real GDP growth has permanently shifted higher. Sustained real growth of 3% and inflation of 2 to 2.5% growth would be pretty good in my book but I’m not sure we can get there with current economic policy and it would leave inflation still above the Fed’s target.
And make no mistake, for investors in US stocks – and the S&P 500 specifically – shifting to a higher level of real growth is necessary to justify current valuations. Some years ago John Bogle developed what he called The “Occam’s Razor” explanation for future stock market returns. It says that over the next decade returns are a function of:
- Starting dividend yield – currently 1.25% for the S&P 500
- Earnings growth rate
- % change in the P/E multiple
There can be some differences in how this gets calculated (trailing P/E or forward, operating earnings or as reported, etc.) but it works to explain past returns:
The difficulty with using the method to predict future returns is that its accuracy is entirely dependent on your ability to predict future earnings growth and the change in P/E. While I have zero confidence that anyone can do that consistently, we can look at past data (long term average, maximum and minimum) to get an idea of what may be in store. We also know, for instance, that, over the long term, earnings will likely grow in line with NGDP growth. Since 1970, S&P earnings have grown at a 6.7% annual pace versus an average year over year change in NGDP of 6.3%. The S&P 500 is not the entire economy so its earnings growth can vary from NGDP growth over considerable periods. For instance, earnings grew an average of 10.6% annually from 2010 to 2020 while NGDP growth was only 4%. But over the long term we should not expect earnings growth to significantly exceed NGDP growth.
So where are we today? The current trailing P/E for the S&P 500 (reported earnings) is 27.9 while the average since 1970 is 19.8. The range, however, runs from a low 7 in 1979 to a high of 47 in 2002. The current dividend yield is 1.25%. Earnings growth over the last year – Q2 this year vs Q2 last year – was 6.4%. Below are several scenarios for potential returns over the next 10 years:
The two wild cards here are earnings growth and the change in the P/E. While we can’t predict either one we do know what variables affect them. For earnings growth it is growth in NGDP (earnings are nominal) while for P/E it is interest rates. If NGDP growth falls – which is what the Fed has been trying to do – then (nominal) earnings growth is also likely to fall. If earnings grow at the long term average (which is right about where it is now) the only way to get a near historical (but still below average) return from the S&P 500 is for the P/E to stay well above the long term average. If it falls to the long term average the return falls to under 5%. And the most likely reason for the P/E to fall would be if interest rates rise and for confirmation of that one need look no further than what happened in 2022. If you want further confirmation, I refer you to the 1970s. The rose colored glasses scenario (or the AI Is Great scenario if you prefer) is for earnings growth to average 10% for the next 10 years and for the P/E to stay the same. What that implies is a significant rise in real GDP – which keeps NGDP growing fast – and benign inflation – which keeps interest rates from rising. I wouldn’t call that impossible but it does seem improbable.
So, did the Fed make a mistake? I don’t know and I’ve said many times, I don’t think the Fed matters as much as most people think. Economic growth per capita is about innovation – productivity growth – which has little to do with interest rates (monetary policy) or grand government plans (fiscal/regulatory policy) and a lot to do with the creativity. True growth is about human capital, the imagination, skills, knowledge and experience possessed by the American people. For much of the last decade economic policy has been about trying to force economic growth through government coercion such as tariffs and industrial policy (CHIPs Act, etc.). We don’t know the final outcome of these policies yet but history isn’t kind to this heavy handed approach. Can we still get the good outcome, the one where AI or some other innovation creates higher growth and lower inflation? Of course we can but I’d hardly call the odds overwhelmingly in favor.
What should an investor do when there are so many potentially sub-optimal outcomes for “the market”? Diversify, diversify, diversify. Develop or adopt a strategy that diversifies across multiple asset classes and investment approaches. Diversification has gotten a bad rap over the last 15 years because US large cap stocks have dominated returns. But when things go badly for those stocks, as they did in the 1970s or the 2000s, diversification is critical. Splitting your equity exposure in the 1970s from 100% S&P 500 to 60% Total US Market and 40% Total International raised your equity return from 5.6% to over 8%. Adding non-US stocks, intermediate term bonds, REITs, gold and commodities to your portfolio in the 2000s turned negative returns into positive. It is said that valuations are not a good market timing tool and that is certainly true. Valuations inform you about risk and when valuations are high, as they are today, so are the risks. You don’t diversify for the times when things go right; you diversify for the times when things go wrong.
Environment
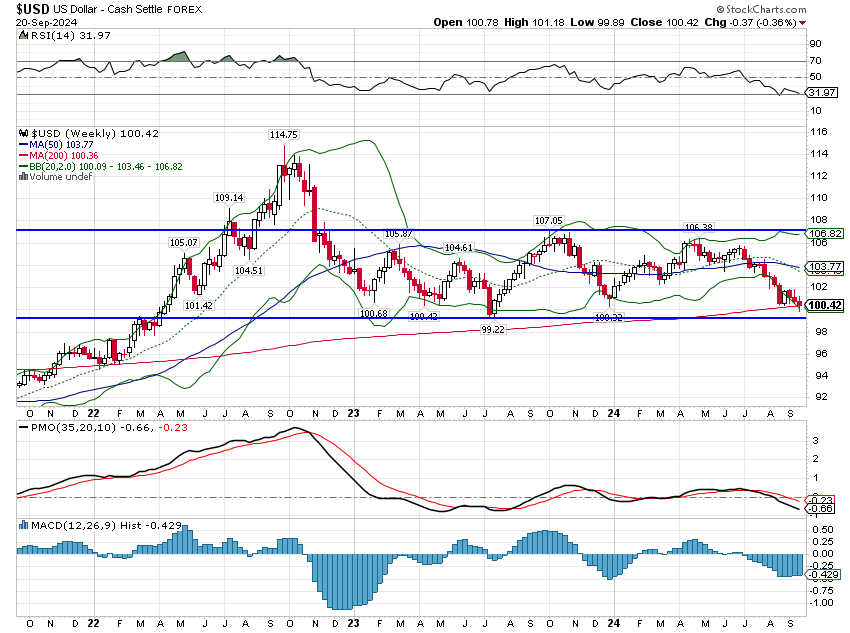
The Fed’s actions last week didn’t change any of the trends in interest rates or the dollar. Both are still in short term downtrends and both are still in the trading ranges that have persisted for most of the last two years.
Markets
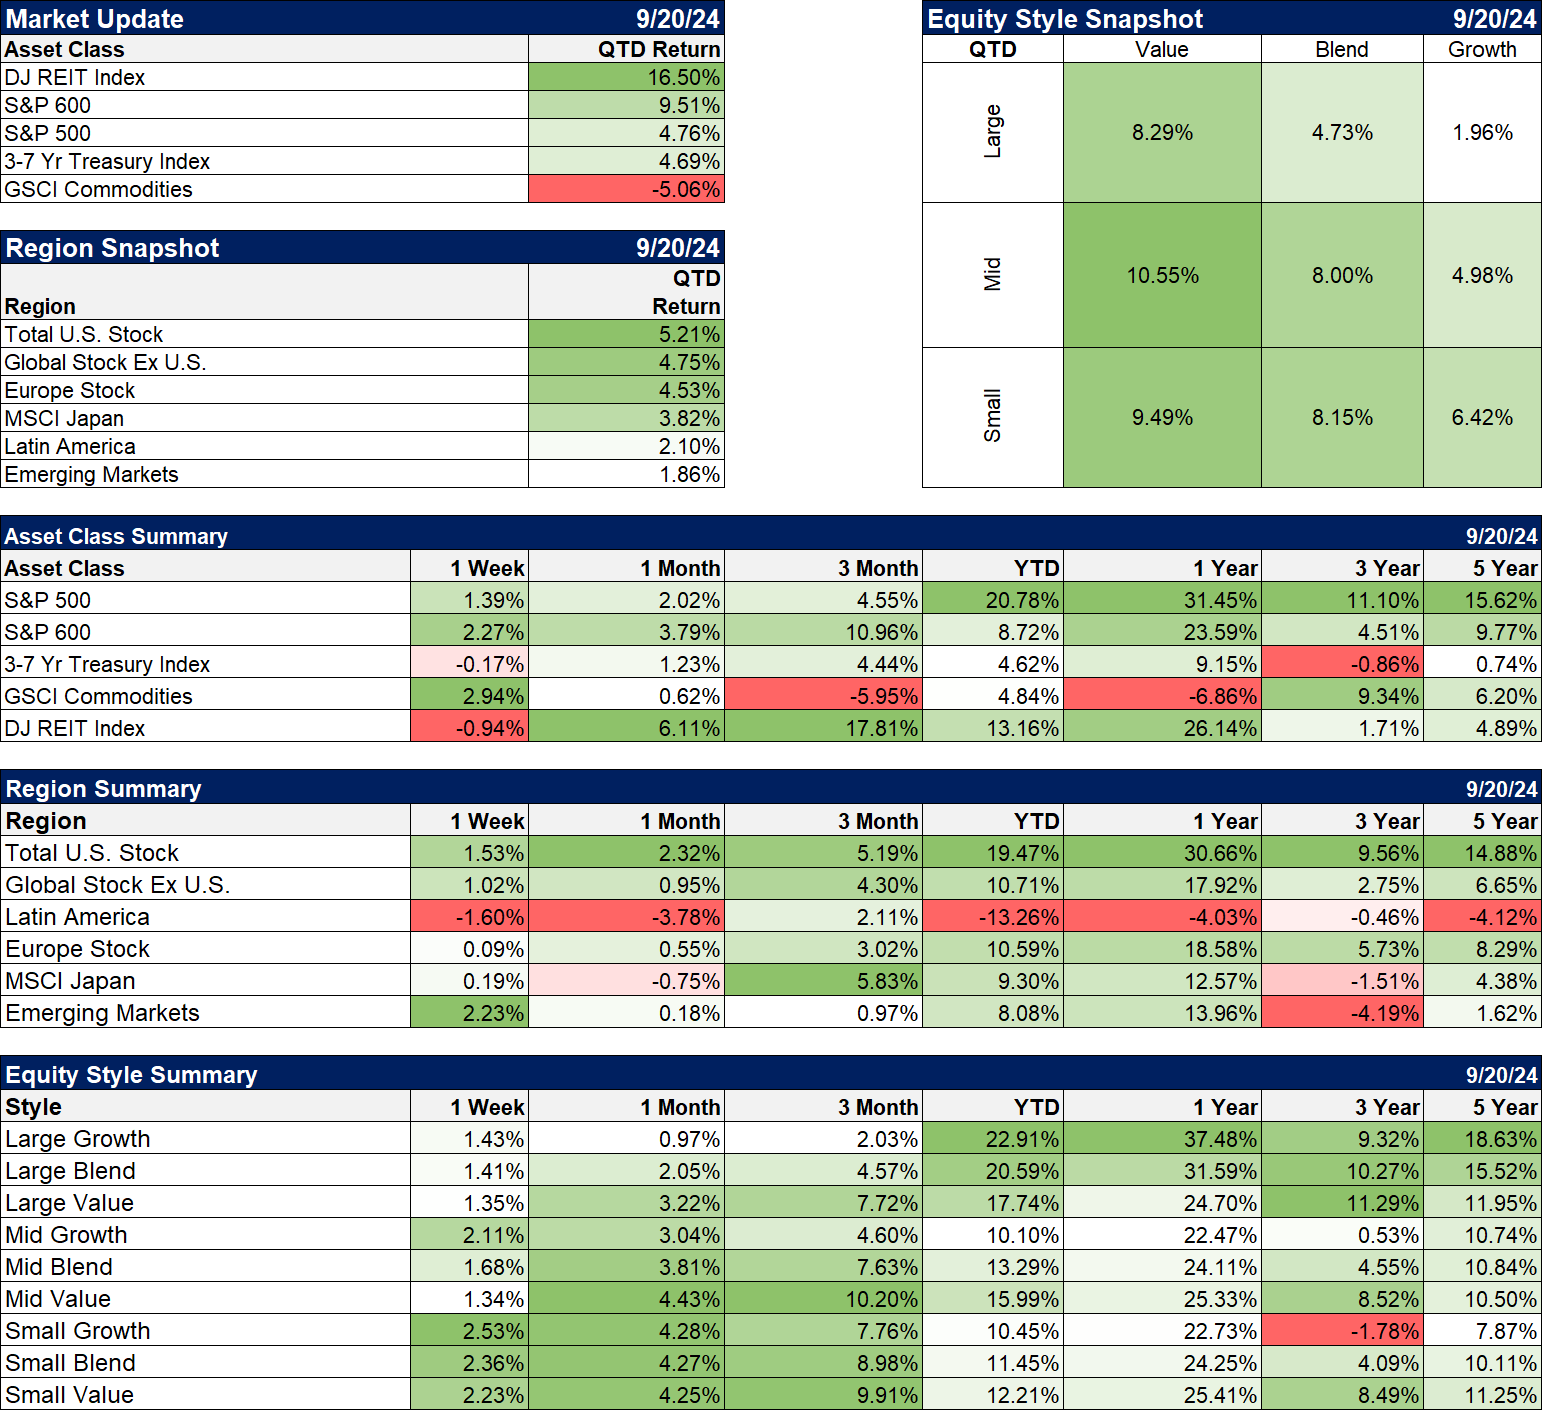
The third quarter is nearing its end and returns so far show the benefits of diversification. REITs are, by far, the best performing asset class for the quarter and one year returns are now just behind the S&P 500. Small cap stocks have also had a stellar quarter and their 1 year returns are also closing in on the S&P 500. Yes, the 3 year returns for both lag the S&P badly but would you rather buy before or after that changes?
The only negative asset class for the quarter is commodities which are also down over the last year. Gold, on the other hand, is up 12.4% for the quarter and 36% over the last year. That’s why we split our hard asset exposure between gold and general commodities. They both tend to perform well when the dollar is weak but the growth outlook matters too. There are other factors that affect returns too and right now China’s economic weakness is weighing on general commodities.
There wasn’t much difference between growth and value last week but value still holds a sizable lead over the last three years.
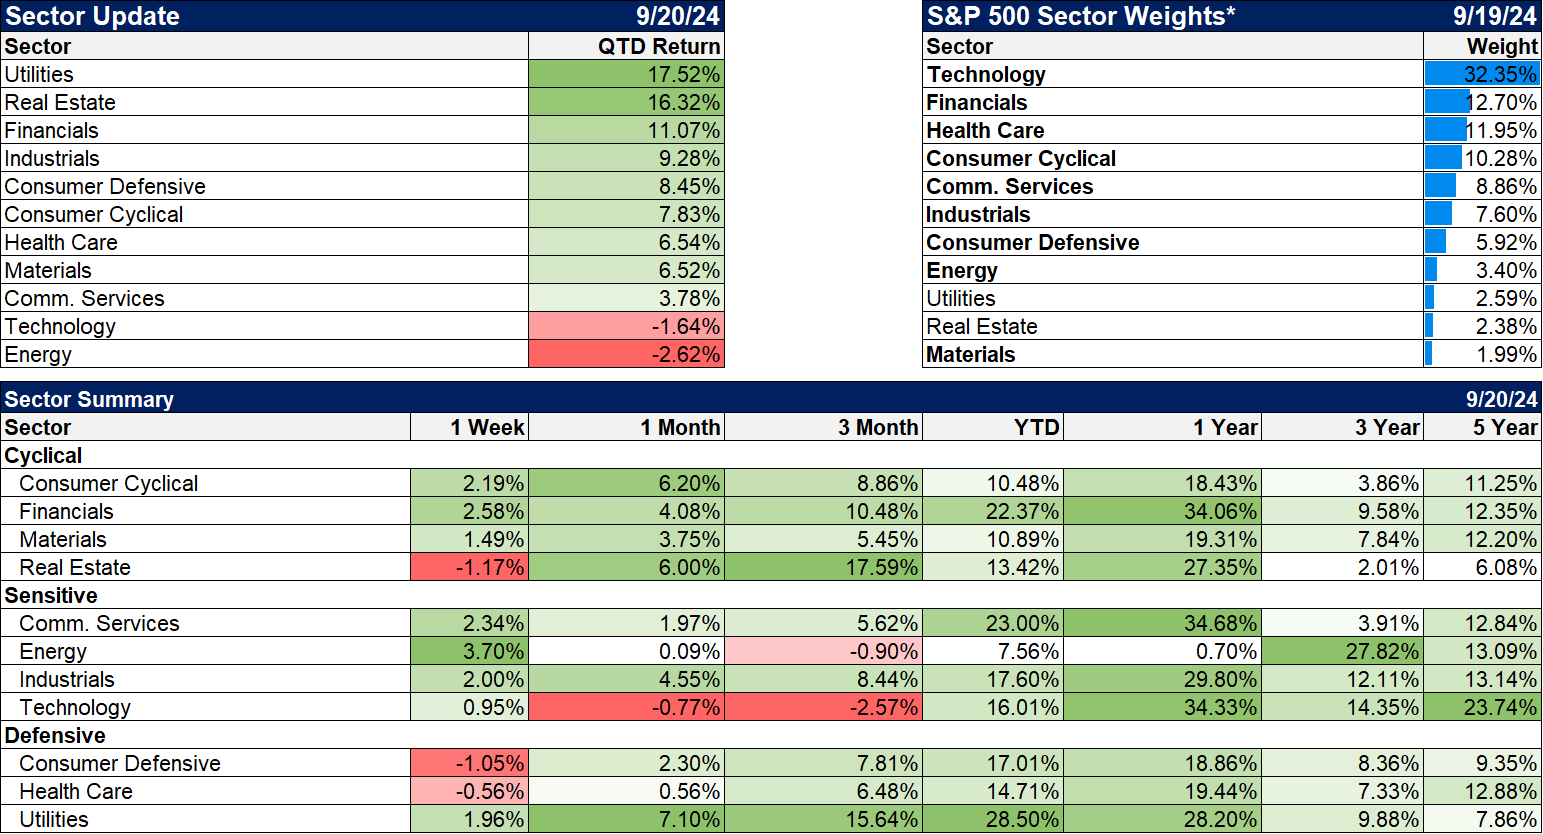
Sectors
The best performing sectors for the quarter are, not surprisingly, all interest rate sensitive. Are rates going to keep falling?
Market/Economic Indicators
Last week’s economic data:
- Empire State manufacturing survey 11.5 vs -4.7 and expected -3.9
- Retail sales 0.1% vs -0.2% expected; still not great up just 2.1% you (negative after inflation)
- Redbook survey of same store sales fell back to +4.6%. Quite a drop from last week but this series is volatile and still in an uptrend.
- Industrial production +0.8% vs -0.9% last month and expectations of 0.2%; yoy 0.0. Industrial production is barely higher today than the beginning of 2008, lower than it was in 2014 and 2018.
- IP Manufacturing production +0.9%, mining output +0.8% (oil) and utilities 0.0; this may be the beginning of the recovery in the goods/manufacturing part of the economy but right now it’s just one month of good data.
- NAHB housing index up to 41 from 39; still weak
- Retail inventories ex-autos +0.5% but inventories/sales ratio unchanged
- Building permits +4.9% vs expectations for flat
- Housing starts +9.6% vs expectations of +3.2%
- Current account continues to deteriorate -$266 billion worse from -$241 billion last quarter; negative for the dollar
- Jobless claims 219k; trending lower again
- Philly Fed +1.7 vs -7 last month and expectations of -1; details not great but a positive number!
- Existing home sales -2.5% vs expectations for flat; not what I expected to see. How long will it take for lower mortgage rates to impact housing activity?
Full story here Are you the author? Previous post See more for Next post
Tags: Alhambra Portfolios,Alhambra Research,Bonds,commodities,currencies,economy,Featured,Federal Reserve/Monetary Policy,federal-reserve,Gold,Interest rates,Investing,Markets,Monetary Policy,newsletter,Real Estate,REITs,stocks,Taxes/Fiscal Policy,US dollar


