


EUR/CHF has rebounded from the 0.9254 December 2023 lows and rallied up to resistance from a key barrier in the form of the 50-week Simple Moving Average (SMA). The pair is probably still in a long-term downtrend despite recent strength. |
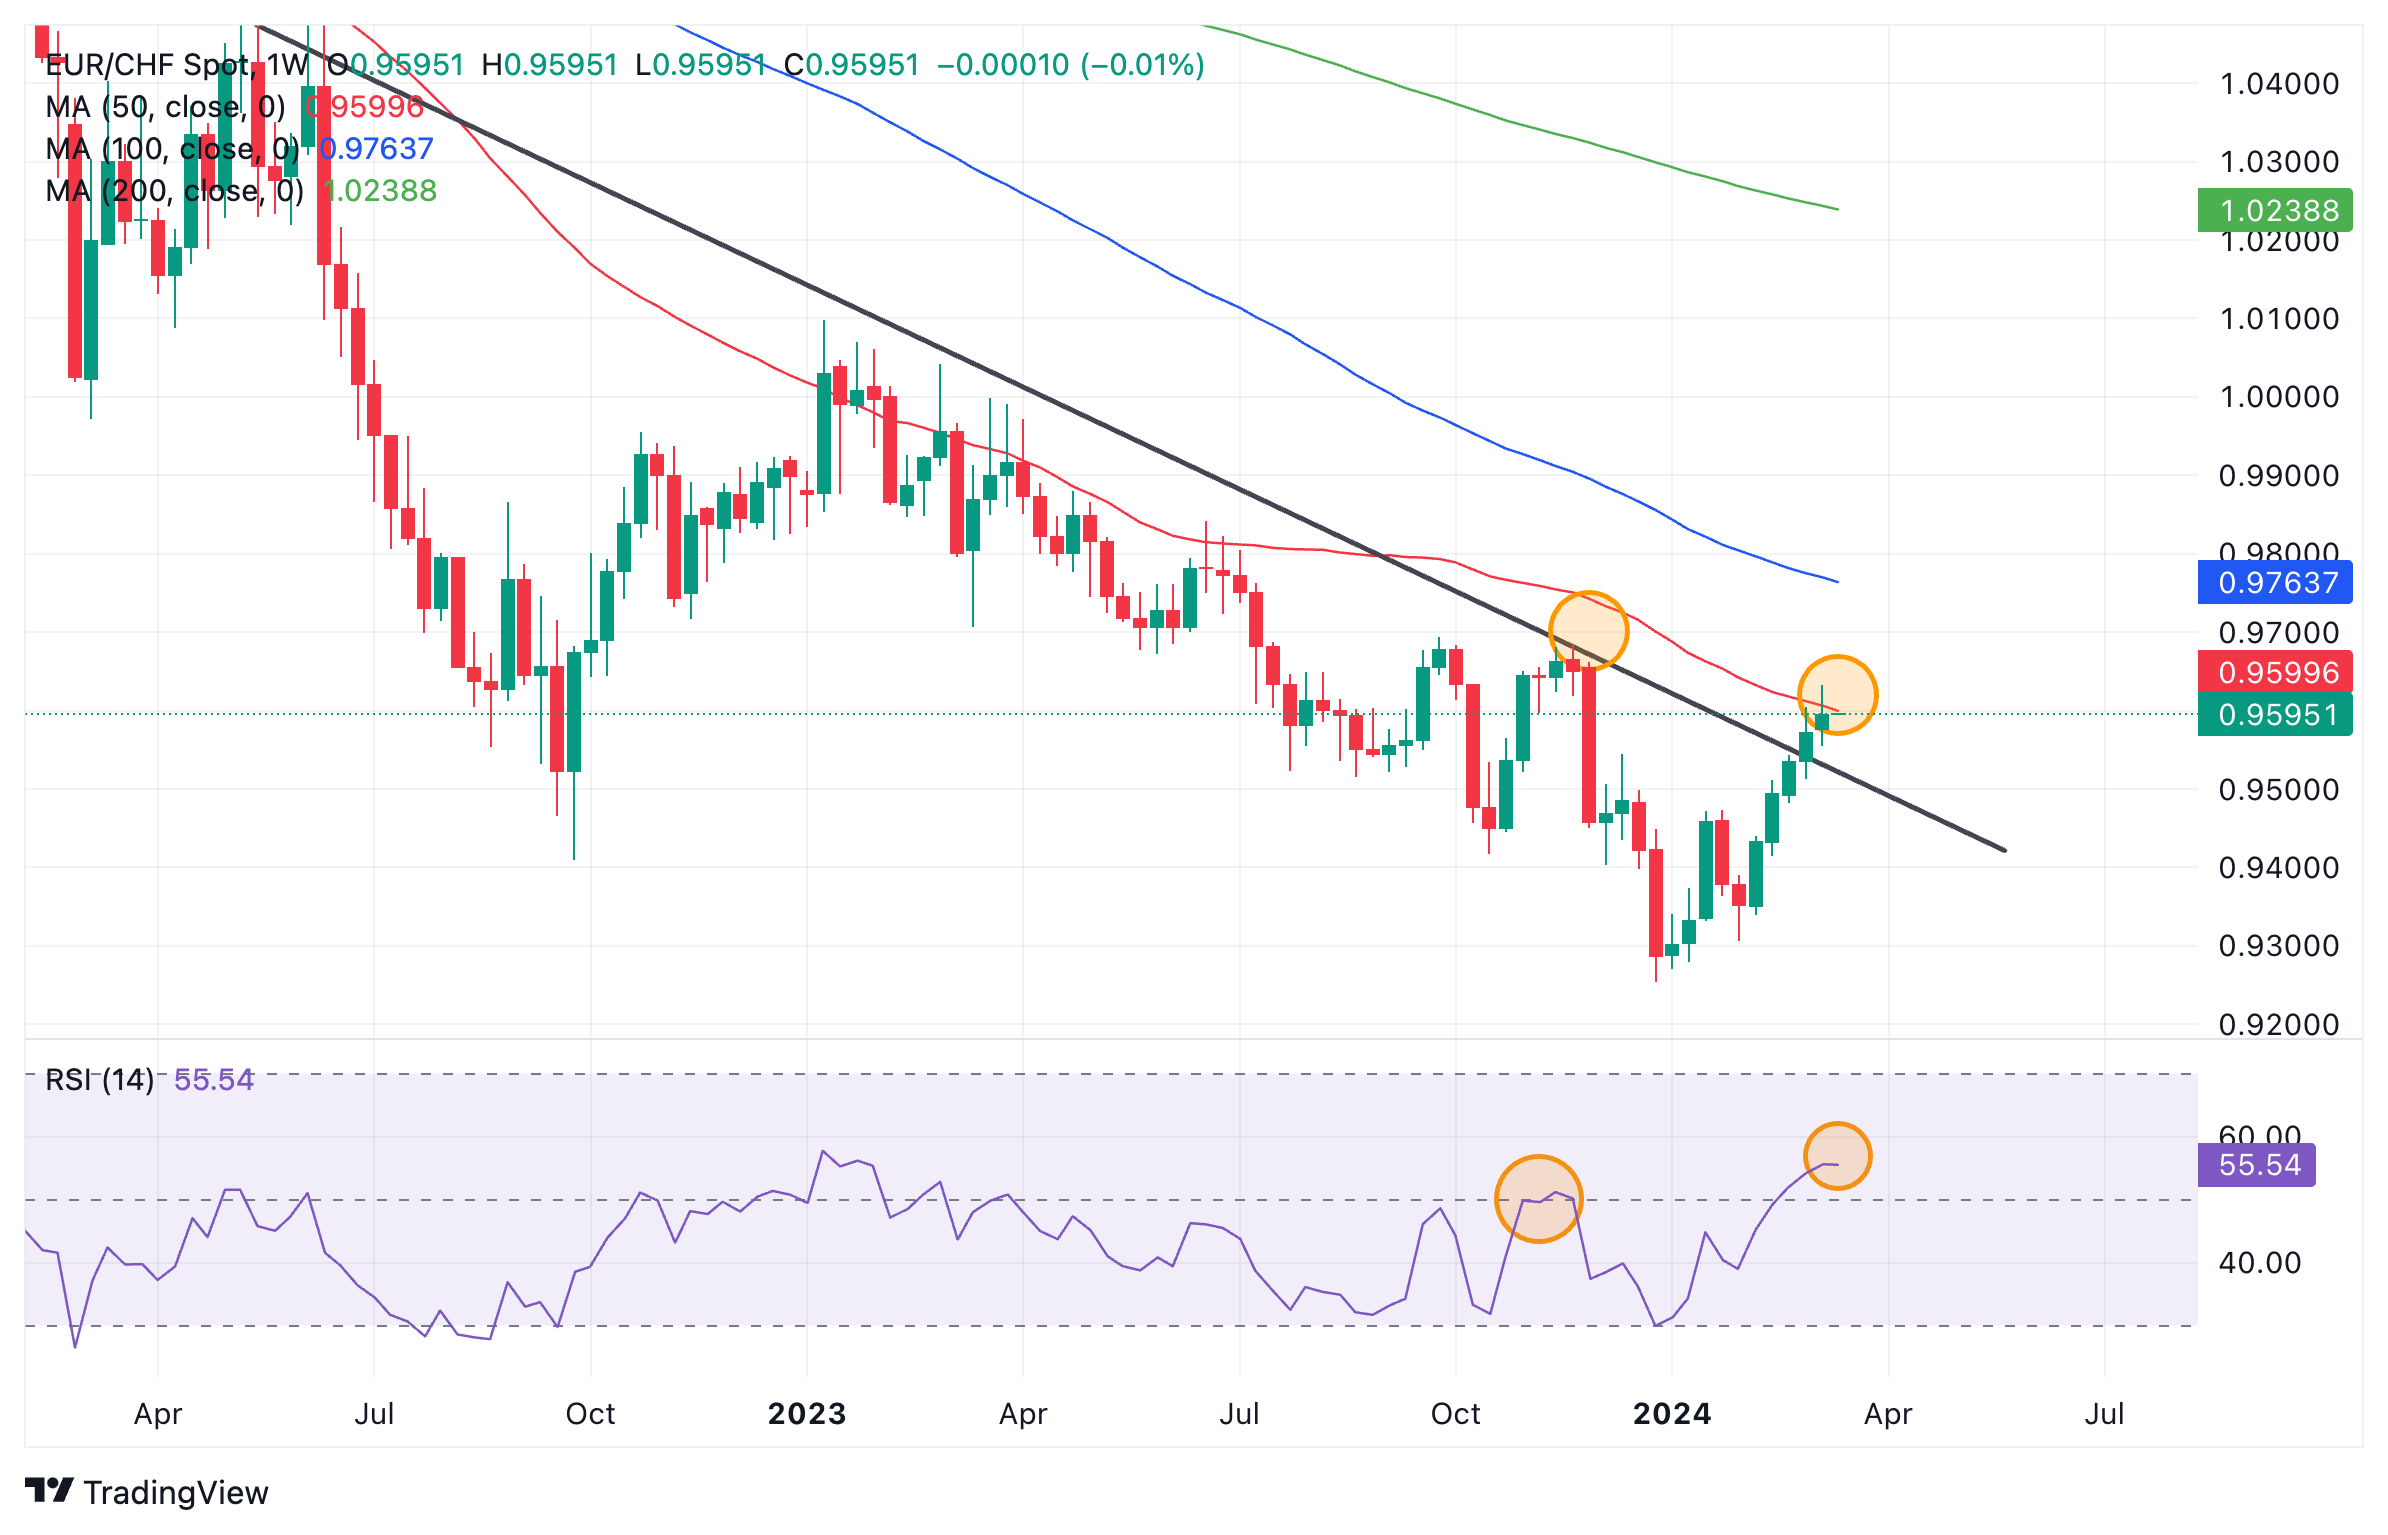 Euro to Swiss Franc: Weekly chart |
| The price has respected the red 50-week SMA on the multiple prior occasions it touched it during its downtrend. This reinforces the level’s strength as a resistance point. It probably indicates the price is about to pullback. There is a good chance it could correct back to the level of the trendline at around 0.9500 for a retest.
The pair is converging with the Relative Strength Indicator (RSI), a momentum study. This is a bullish sign. The most recent peak in price was accompanied by a relatively higher peak in RSI when compared to the previous peak in price (circled). This is convergence and suggests underlying strength. A further bullish sign is that the pair has broken above the trendline. |
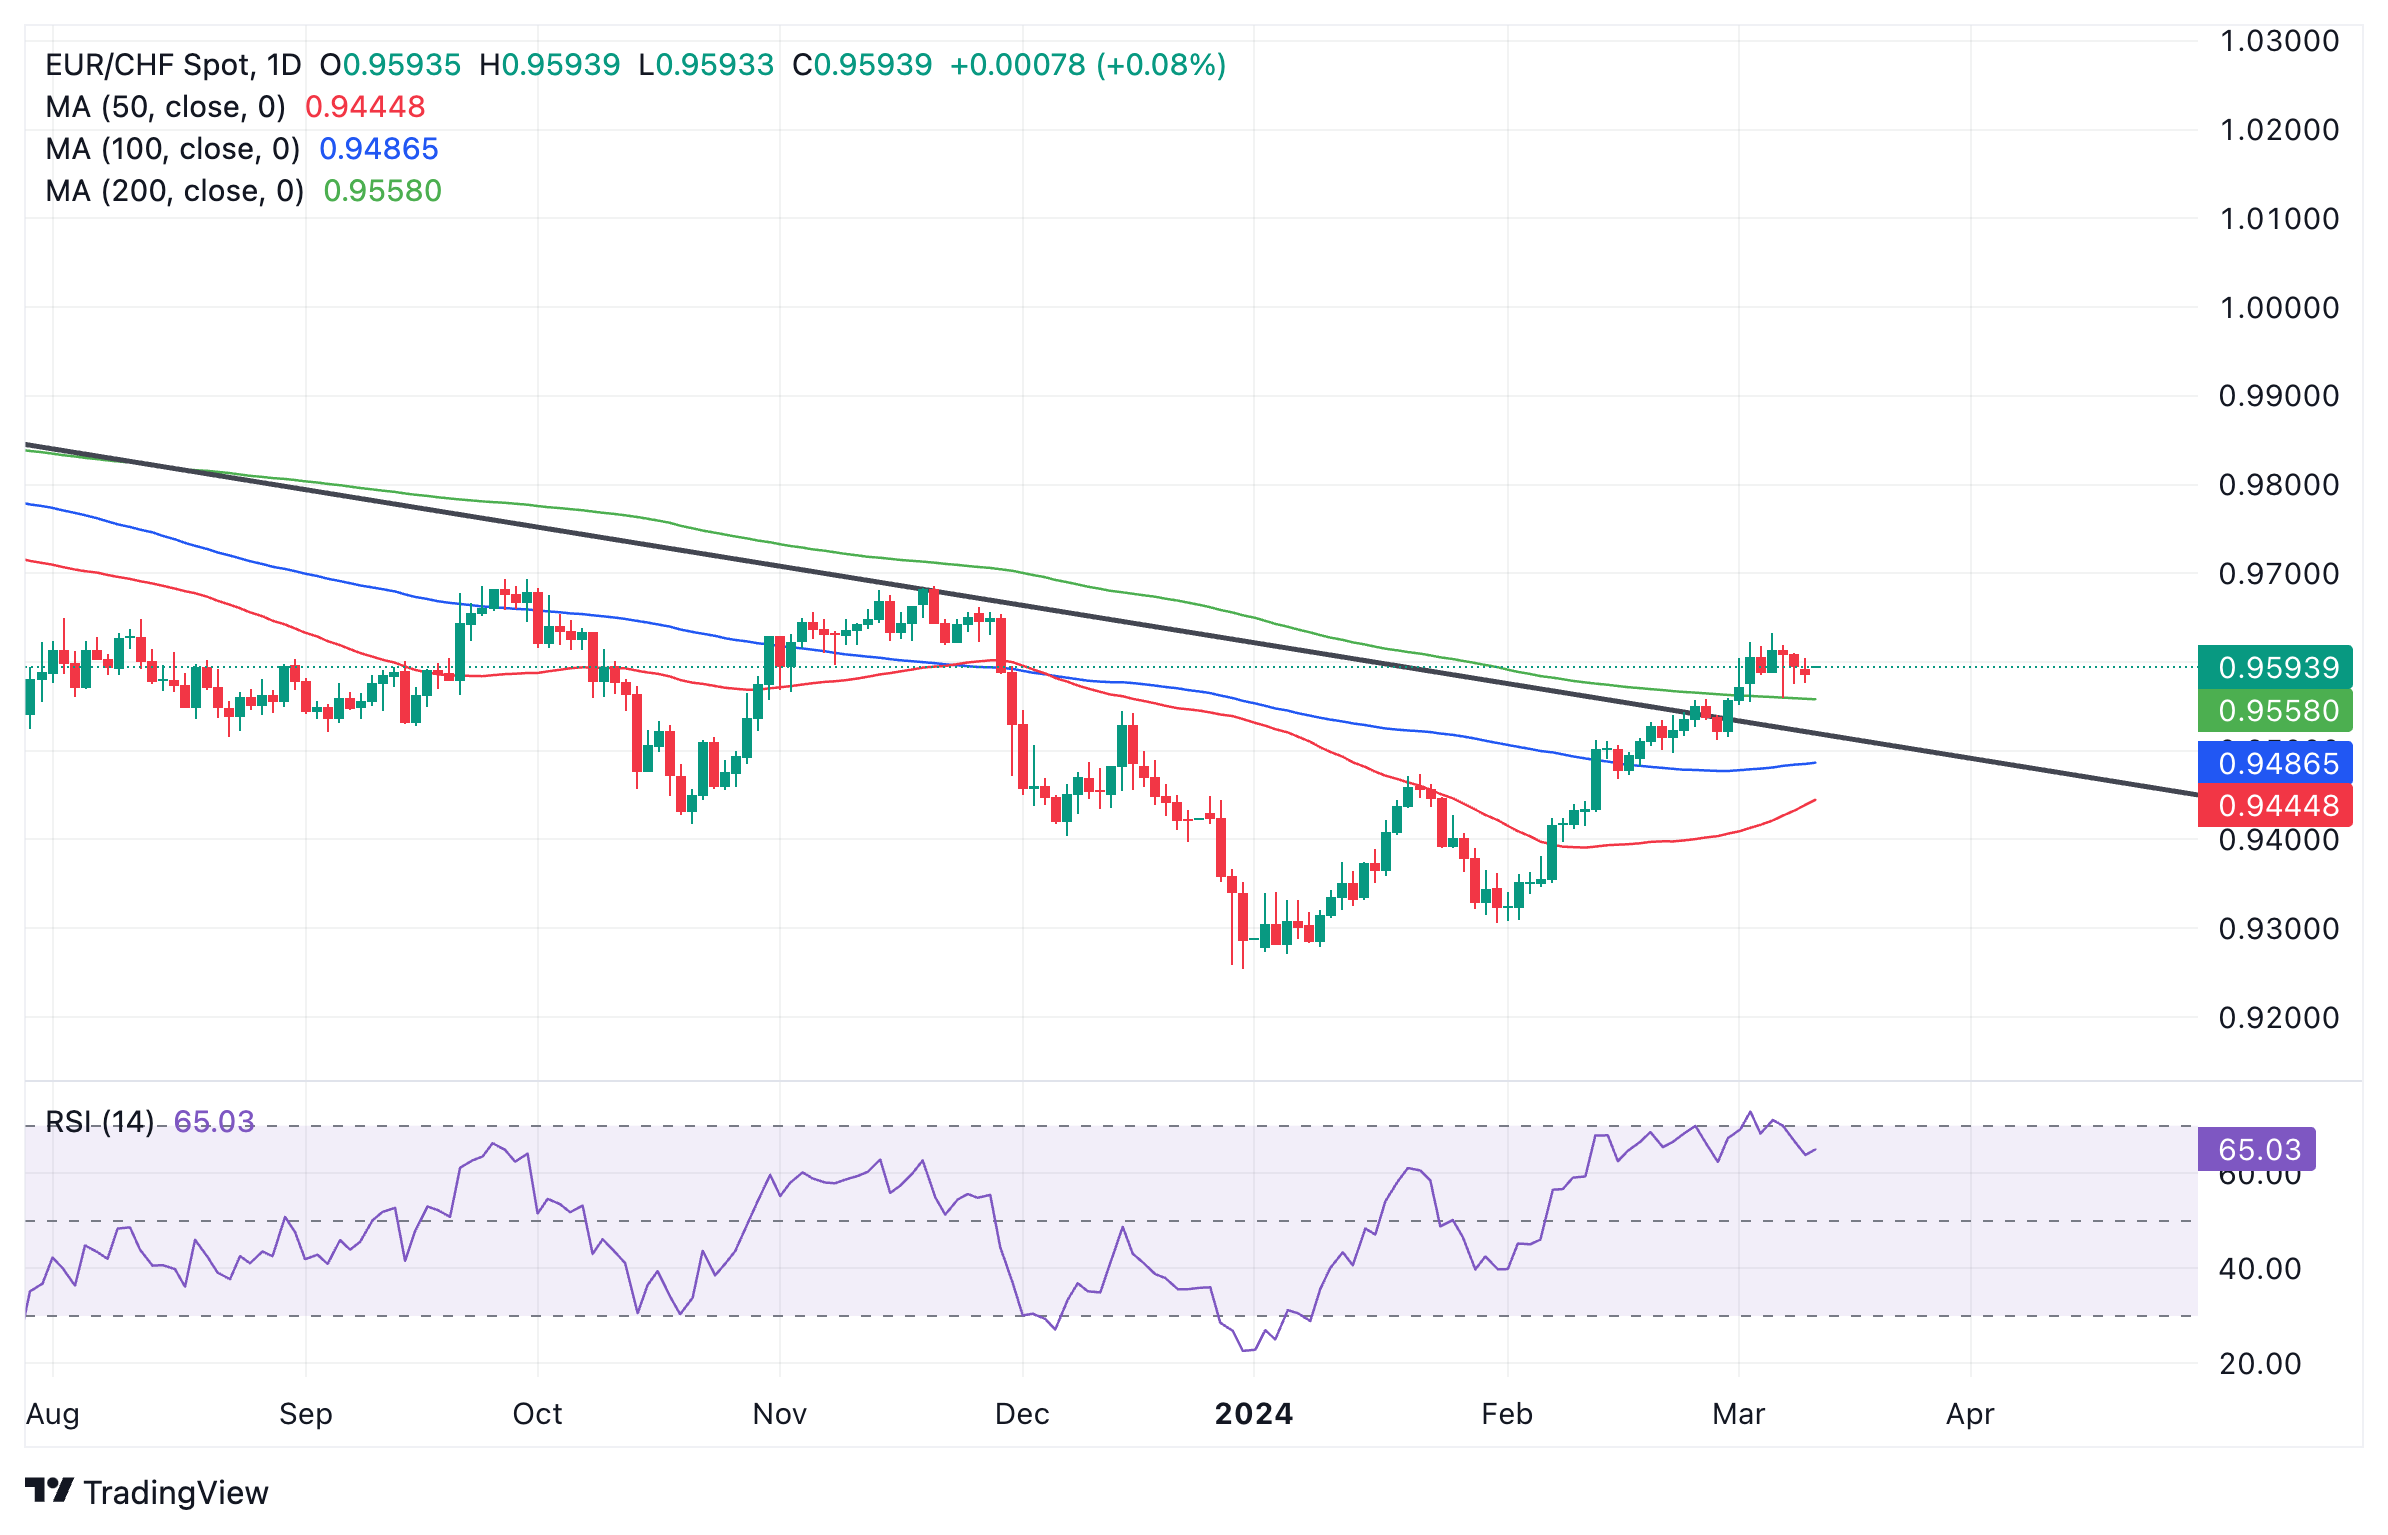 Euro to Swiss Franc: Daily chart |
| EUR/CHF has just exited overbought extremes on the RSI on the daily chart. This is interpreted as a signal to sell long positions and open short positions. It suggests the pair could pullback down, at least to the level of the trendline at about 0.9500.
The pair has broken above all the key Moving Averages and the 200-day SMA is acting support. EUR/CHF has also moved above the previous higher low of the downtrend. These are both signs indicating that it is probably in a bullish intermediate trend, favoring bulls on that time horizon. EUR/CHF has formed a Symmetrical Triangle on the 4-hour chart suggesting indecision. The pattern has equal chances of it breaking out in either direction, however, some analysts hold that the odds slightly favor a breakout in the direction of the trend prior to the formation of the triangle, which in this case is bullish. Should price breakout higher it will probably not rise very much higher before capitulating since triangles are usually the penultimate moves in trends. The RSI has declined visibly during the formation of the triangle, however, suggesting underlying weakness and a chance price could break lower. The 4-hour chart is used to assess the short-term trend. The series of rising peaks and troughs since the December 2023 lows indicates the pair is in a short-term uptrend. |
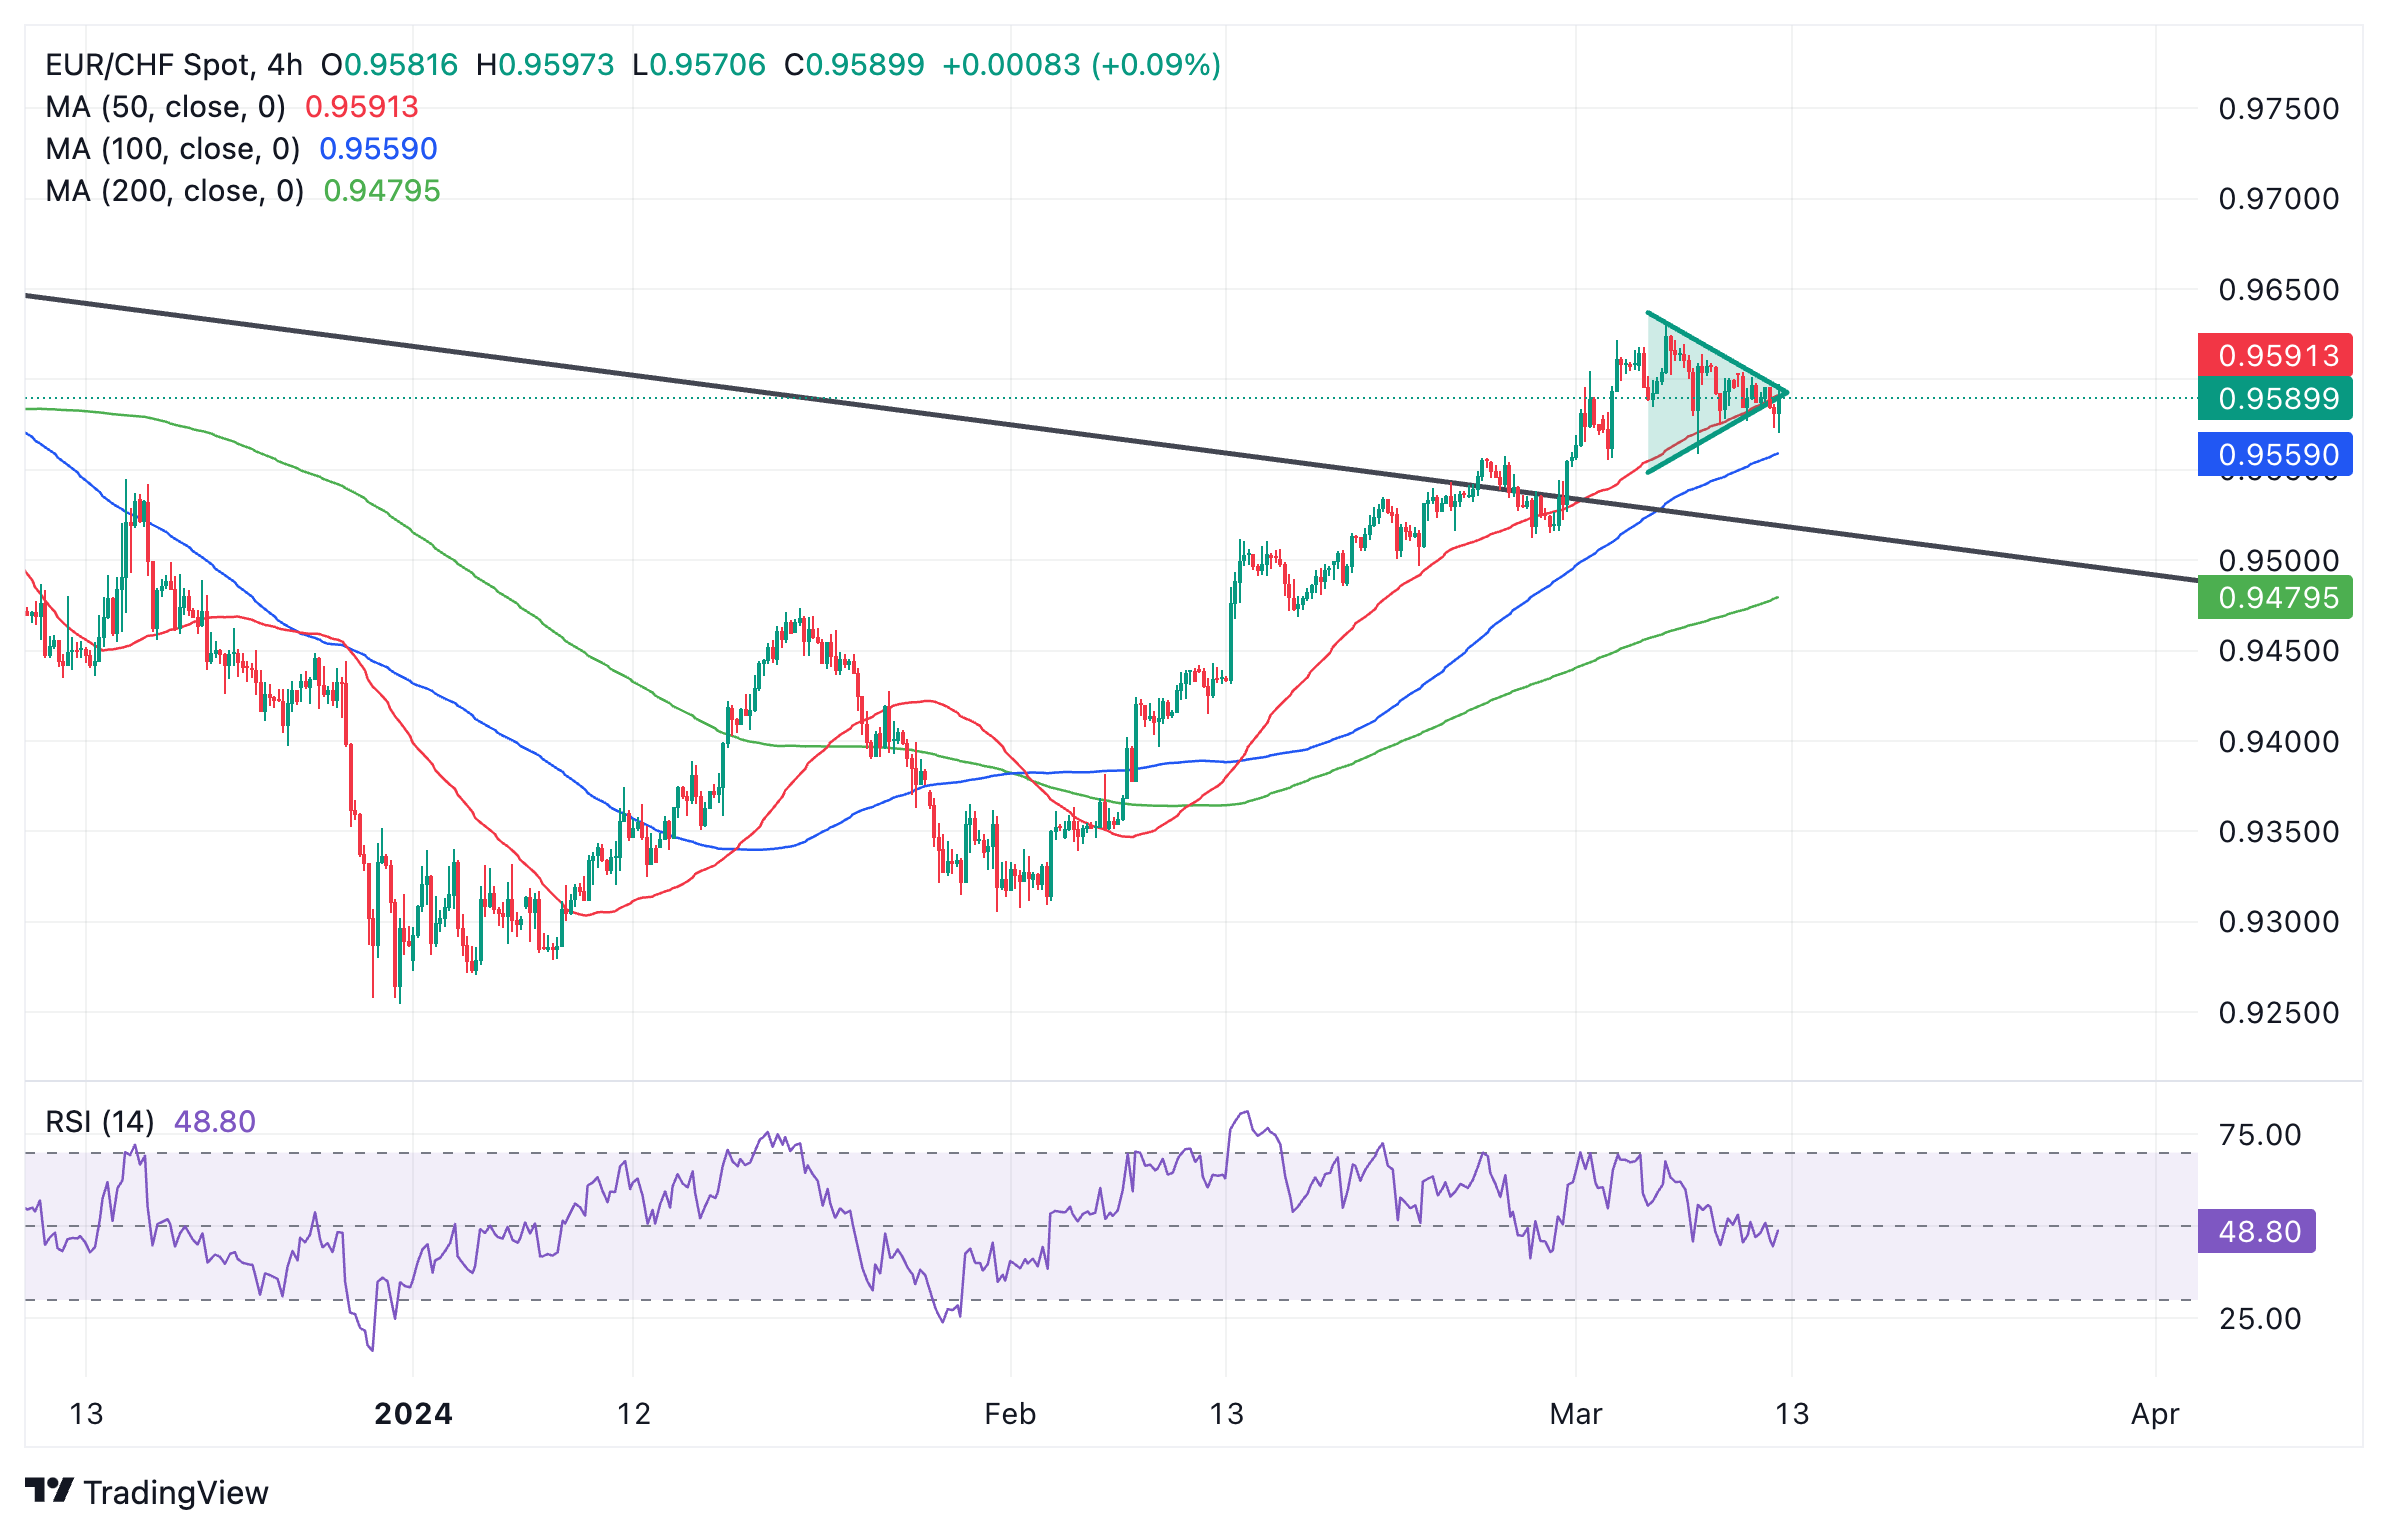 Euro to Swiss Franc: 4-hour chart |
Tags: Featured,newsletter


