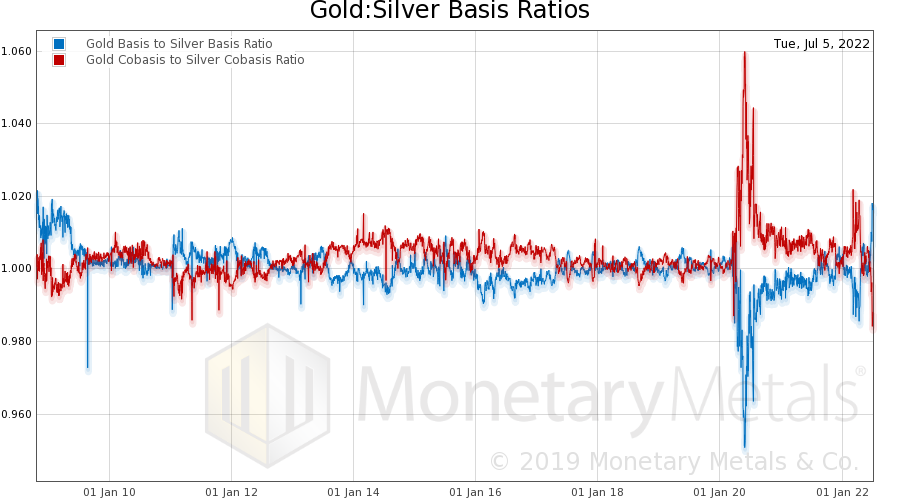
| Something has happened which has not occurred since 2009. The silver basis—our measure of abundance of the metal to the market—has gone way under the gold basis. This means silver is less abundant to the market than gold. Here is the picture.
The blue line is the ratio of the gold basis to the silver basis (and red is the ratio of the gold cobasis—scarcity—to the silver cobasis). This condition has not occurred in recent years, because the trend has been a rising gold-silver ratio. That is, silver has been generally falling as measured in gold terms. The reason is that there has been no lack of sellers coming to market). Selling physical metal pushes down the bid on the spot price. Cobasis = spot(bid) – future(ask) In other words, selling physical metal tends to push down the cobasis (and push up the basis). Which means that silver, relative to gold, has generally had a higher basis (and when it was lower, it did not go much below gold’s and did not stay there for very long). |
|
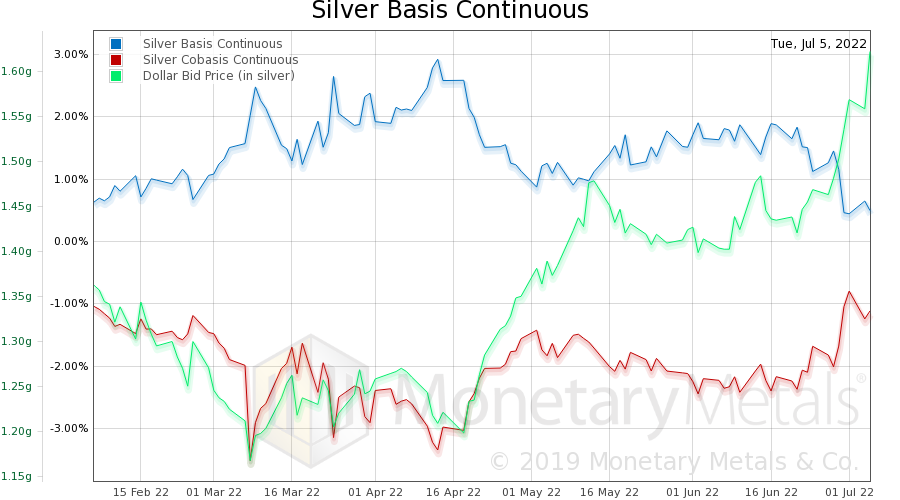
Is This the Moment We’ve Been Waiting For?It is premature to say how durable this is, if silver metal will come to market from private hoards when the price blips up. Or if this is the Moment Everyone Has Been Waiting For™, the final capitulation in the silver price and the start of a multi-year run up in its price. We emphasize that it’s premature to make this call. We want to see how the basis reacts to the next price blip (which seems likely to come here). Does the basis shoot back up to normal? Or does the cobasis stubbornly remain low, and the metal continue to be scarcer than gold, even as its price moves higher relative to gold? Let’s look at a picture of the silver basis by itself. This is the continuous basis, but the September contract is in backwardation (which we strictly define as cobasis > 0, when it’s profitable to de-carry metal, i.e. sell metal and simultaneously buy a futures contract). Backwardation should never occur in a monetary metal. |
|
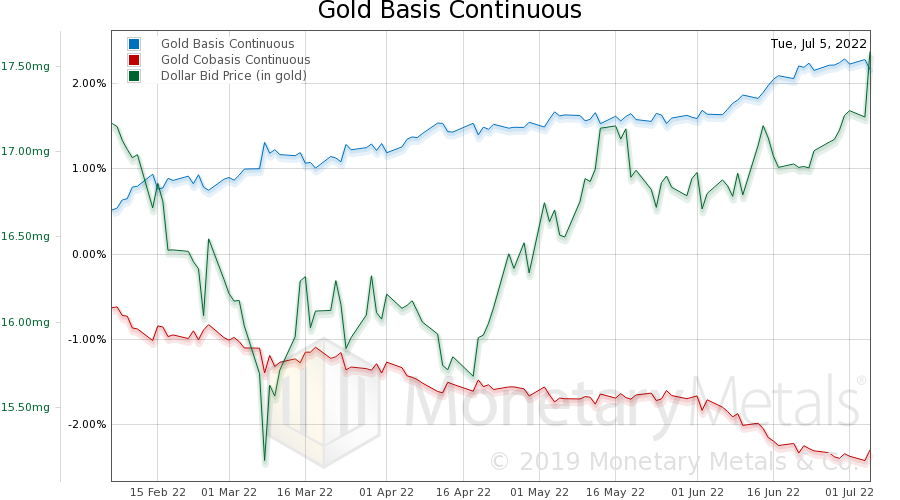
| For comparison, here’s the gold chart.
Note the rising basis, even while the dollar is rising. The basis goes from 1.5% on April 18, to 2.2% on July 5. This occurred when the price of the dollar rose from 15.68 milligrams gold to 17.59mg (that is, the price of gold fell from $1,983 to $1,768, or 10.8%). Gold became more abundant to the market, as its price fell. This is not what most people want to see! During the same period, the price of the dollar in silver terms rose from 1.2 grams to 1.6g (i.e. the price of silver fell from $25.92 to $19.16, or 26.1%). However, the silver basis fell from 2.58% to 0.49%. |
|
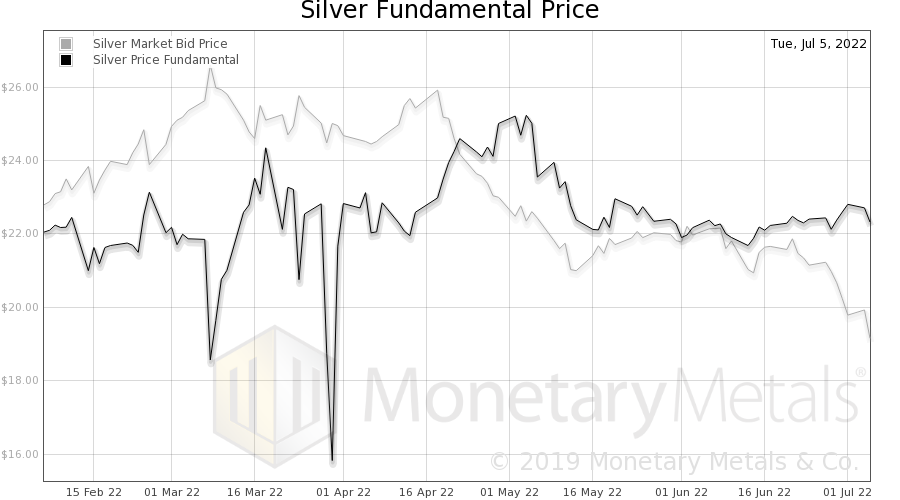
| Next, let’s look at the calculated Monetary Metals silver fundamental price.
The fundamental price is well over $22. Also, notice that it’s not a falling trend. It’s been sideways since well back into 2021. |
|
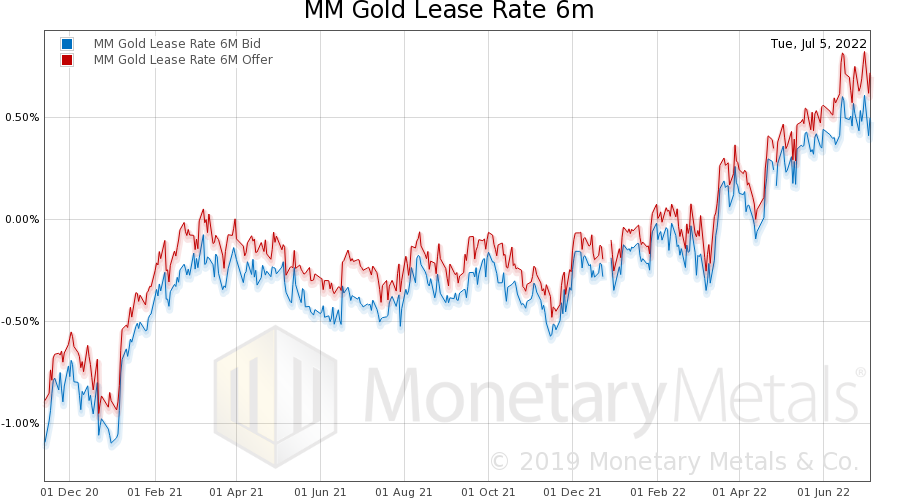
The Silver Squeeze on BusinessesFinally, let’s look at the gold and silver lease rates. The London Bullion Market Association used to provide these, until it ceased publishing due to regulatory compliance costs in 2015. Monetary Metals calculates them from public market data. Our lease rate shows the zero-arbitrage point. In the real world, a bank would charge this rate plus its internal cost of funding, plus its administrative costs, plus its desired profit margin, plus a credit spread. In other words, do not take our rate as an indication of what a real business pays. However, pay attention to the trend. First, here is gold. |
|
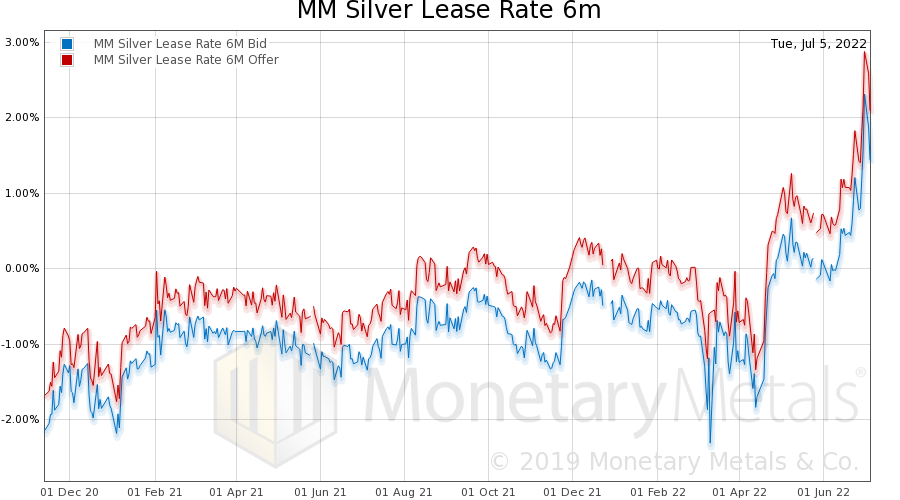
| It’s a rising trend. But this is nothing compared to silver!
Silver is getting downright expensive to lease. |
Dollar Gyrations vs Metal Leasing
One final word about lease rates. These are based on arbitrage in the dollar markets, and therefore the lease rate moves around based on all sorts of factors in the dollar markets.
Monetary Metals leases metal to businesses who need metal inventory or work-in-progress such as refiners. Since we obtain the metal from investors who own it, these gyrations do not affect us. Our lease rate is stable, which is a win-win for both metal owners and metal-using businesses. In the meantime, we’ll continue to monitor this situation and report on what the data says.
Make sure to subscribe to our YouTube Channel to check out all our Media Appearances, Podcast Episodes and more!
Additional Resources for Earning Interest on Gold
If you’d like to learn more about how to earn interest on gold with Monetary Metals, check out the following resources:
In this paper we look at how conventional gold holdings stack up to Monetary Metals Investments, which offer a Yield on Gold, Paid in Gold®. We compare retail coins, vault storage, the popular ETF – GLD, and mining stocks against Monetary Metals’ True Gold Leases.
The Case for Gold Yield in Investment Portfolios
Adding gold to a diversified portfolio of assets reduces volatility and increases returns. But how much and what about the ongoing costs? What changes when gold pays a yield? This paper answers those questions using data going back to 1972.
Full story here Are you the author? Previous post See more for Next post
Tags: Basic Reports,Featured,newsletter


