Joseph Y. Calhoun
My articles My siteAbout meMy videosMy books
Follow on:LinkedINTwitterSeeking AlphaAmazon
Late last year I wrote a weekly update that focused on the speculative nature of the markets. In that article, I focused on the S&P 500 because I wanted to make a point, namely that owning the S&P 500 did not absolve investment advisers of their fiduciary duty. If you intentionally make the S&P 500 – or any other index – your primary source of equity exposure, you have a responsibility to know what you own. You need to know the risks involved with owning the index and how that relates to your clients’ risk tolerance.
And that is why I’m on a bit of rant today about speculation and what is prudent. I said above that I wouldn’t own an actively managed fund that owns Tesla because it shows a disregard for the well-being of its shareholders. But what about an index fund that owns Tesla? What has always been prudent – owning a low-cost index fund – has now become a more speculative investment because of the degree of speculation in the market. How speculative? Well, I’m glad you asked.
The S&P 500 has become the default stock market investment for an entire generation of investors. It has become so embedded in our investment culture that few even bother to find out what they own; they just want to own “the market”. But is that what you get when you buy SPY? Consider these stats:
- The top 10 stocks in the S&P 500 make up 30.1% of the fund. Is this the diversification you expected when you bought an index with 500 stocks (actually 507)?
- These top 10 stocks have an average P/E of 43.7. Yes, that includes Tesla at 137 times earnings (based on data from Morningstar) so if we take that out the average drops to…33.3.
- The top 20 stocks in the index make up 38.9% of the fund with an average P/E of 38.3
- The top 25 stocks make up 42.2% of the fund with a P/E of 34.6
- Two of the stocks in the top 10 are different share classes of Alphabet (Google). So you really have 30% of the fund is just 9 stocks. Furthermore, if you exclude JP Morgan and Berkshire Hathaway, you have 27.6% of the fund invested in 7 companies: Microsoft, Apple, Amazon, Tesla, Alphabet, Meta Platforms (Facebook), Nvidia (chip maker for crypto mining). Do you think those companies will be in the top 10 a decade from now? Only 4 of the top 10 from 2011 are still in there. Only one stock from the 2000 top 10 remains (Microsoft).
Today, after a 20%+ drawdown in the S&P 500 I want to return to the S&P 500 and see if the risk has been sufficiently reduced to allow a prudent investment in the index.
An update on the 5 points I made above last November:
- The top 10 stocks in the S&P 500 make up 27.2% of the fund. Improved but still well above the long-term average of 18%.
- These top 10 stocks have an average P/E of 29.9. Tesla’s P/E had dropped to a mere 59.5 but if we take that out the top 10, it still has an average P/E of 26.6. This is obviously better but far from cheap and still elevated versus history.
- The top 20 stocks in the index make up 36.9% of the fund with an average P/E of 22.6. The concentration of the fund has only improved slightly. The P/E has dropped considerably but is still elevated relative to history.
- The top 25 stocks make up 40.6% of the fund with a P/E of 22.4. Ditto
- Two of the stocks in the top 10 are different share classes of Alphabet (Google). So you really have 27.2% of the fund is just 9 stocks. If you exclude Berkshire Hathaway you have 25.6% of the fund in 8 stocks. JP Morgan and Meta (nee Facebook) have already fallen out of the top 10 showing just how quickly things can change.
The risks of the fund, based on some very simple metrics, are only slightly less than they were 6 months ago when the index was 20% higher. The P/Es above are based on trailing 12-month earnings so maybe things look a little better based on forward earnings estimates but there is nothing so wrong as a Wall Street analyst at an economic turning point.
Earnings for the S&P 500, according to Howard Silverblatt’s work at S&P, are expected to rise 7.7% in 2022. Estimates have come down very slightly since the end of Q1, from $225.50 to $224.24, less than 1%. Is that plausible? I suppose it could be since we’re talking about nominal earnings but if the economy continues to slow, I don’t see how earnings don’t follow suit. How much? No idea.
Needless to say, we aren’t rushing out to buy the S&P 500. That isn’t to say, by the way, that it won’t go up from here. Valuations and fundamentals don’t really tell you much about returns in the immediate future but they do tell you a lot about risk. And the risk of owning the S&P 500 is, in my opinion, still too great to warrant a long-term allocation. There is so much focus on the S&P 500 – it is the market for most people – but you don’t have to own it. That doesn’t mean you have to shift to individual stocks – although I think you’ll see more people doing that in coming years – and it doesn’t mean you have to make concentrated sector bets. There are other broad market indexes you can use to construct a portfolio.
Here’s the same review using the value portion of the S&P 500:
- The top 10 stocks in the S&P 500 value index make up 19% of the fund.
- These top 10 stocks have an average P/E of 17.5.
- The top 20 stocks in the index make up 28.4% of the fund with an average P/E of 17.
- The top 25 stocks make up 32.4% of the fund with an average P/E of 16.5.
I will be the first to say that this is not particularly cheap for a value fund. But it is probably fairly valued and doesn’t have the concentration risks of the full S&P 500. And there are several high-quality value funds that have lower overall valuations and reasonable growth expectations. One we use holds stocks with an average P/E of 13 with expected earnings growth over 10%. It has outperformed the S&P 500 this year by a wide margin and over the last 10 years. There are others out there with similar track records that own cheap stocks. That doesn’t mean, of course, that the stocks these funds own won’t go down – they have this year just a lot less than the “market” – but the risks are considerably less than owning the S&P 500 with a concentrated bet on growth stocks.
I said last week that this period reminds a bit of the 2000-2002 bear market. That isn’t, by the way, because I expect a mild recession like the one we had back then. I don’t know when recession will arrive – but it always does – or how deep any contraction might be. I have read a plethora of research on the methods of predicting recessions and have found none that can offer anything more than crude approximations. There are some very useful indicators (meaning not a lot of false signals) but even the most accurate only get you within 6 months of the start of recession with some of them coming before and some of them after (which has proven close enough in the past; that usually allows investors to reduce equity exposure within 10% of the top). As for the depth of any recession, I don’t know of any method that provides any clarity whatsoever.
The reason I see this period as analogous to the 2000-2002 bear market is the degree of speculation that preceded it. I have been an investor since the early 80s – professionally since 1991 – and I thought I would never see a period of speculation like what I witnessed at the turn of the century. I can say now, that I was wrong. The crypto/NFT/SPAC/meme stock craze of the last few years was truly stunning and I think easily surpassed the excesses of the dot com era. The frauds and scams running in the crypto space alone over the last year – some of which continue today – took speculation to new heights that still stun me today. Millions of dollars spent on….nothing. Bored Ape Yacht Club? Are you kidding me? I have no words to describe this idiocy. Don’t send me any emails telling me how I just don’t get it. I won’t read them. Because I do get it. I got it in 2000 and I get it today. I participated in the technology boom of the 90s from 1992 to 1998. I missed the craziness of 1999 and I was ridiculed for it at the time. But I also missed the crash so I have no regrets. And so far, I have no regrets about crypto either. If you rode the craze up and cashed out near the top, I commend you and wish you well. I have to invest – not speculate – under the Prudent Man (Person) rule and nothing in crypto has ever come close to satisfying that standard.
| What interests me today about that period though is what happened during the bear market. There is, I think, a general belief that stocks – all stocks – went down in that period. Everyone “knows” the NASDAQ went down 75% (actually the NASDAQ 100 fell 82.9% from peak to trough on a closing basis) and the S&P 500 fell 50% (actually 49.1%). Those indexes peaked within a few days of each other in March of 2000 and hit their lows in October of 2002, a long bear market that no one who lived through it will ever forget. For those who didn’t live through it and today invest in an era where everything happens quickly, it is hard to grasp how “stocks” fell, almost continuously, for over 2 years. But it wasn’t “stocks” that fell for over 2 years. It was growth stocks – mostly large-cap growth stocks – that were ridiculously valued going into that bear market and that’s what went down for over 2 years. There were other stock market indices that were up during that period and a look back might be useful for investors today.
Like today, what was cheap back then was value. Size also played a role with small and mid-caps cheaper than large-caps – as it is today. During the bear market, small and mid-cap value outperformed by a wide margin. Large value did better than growth but was still down substantially: |
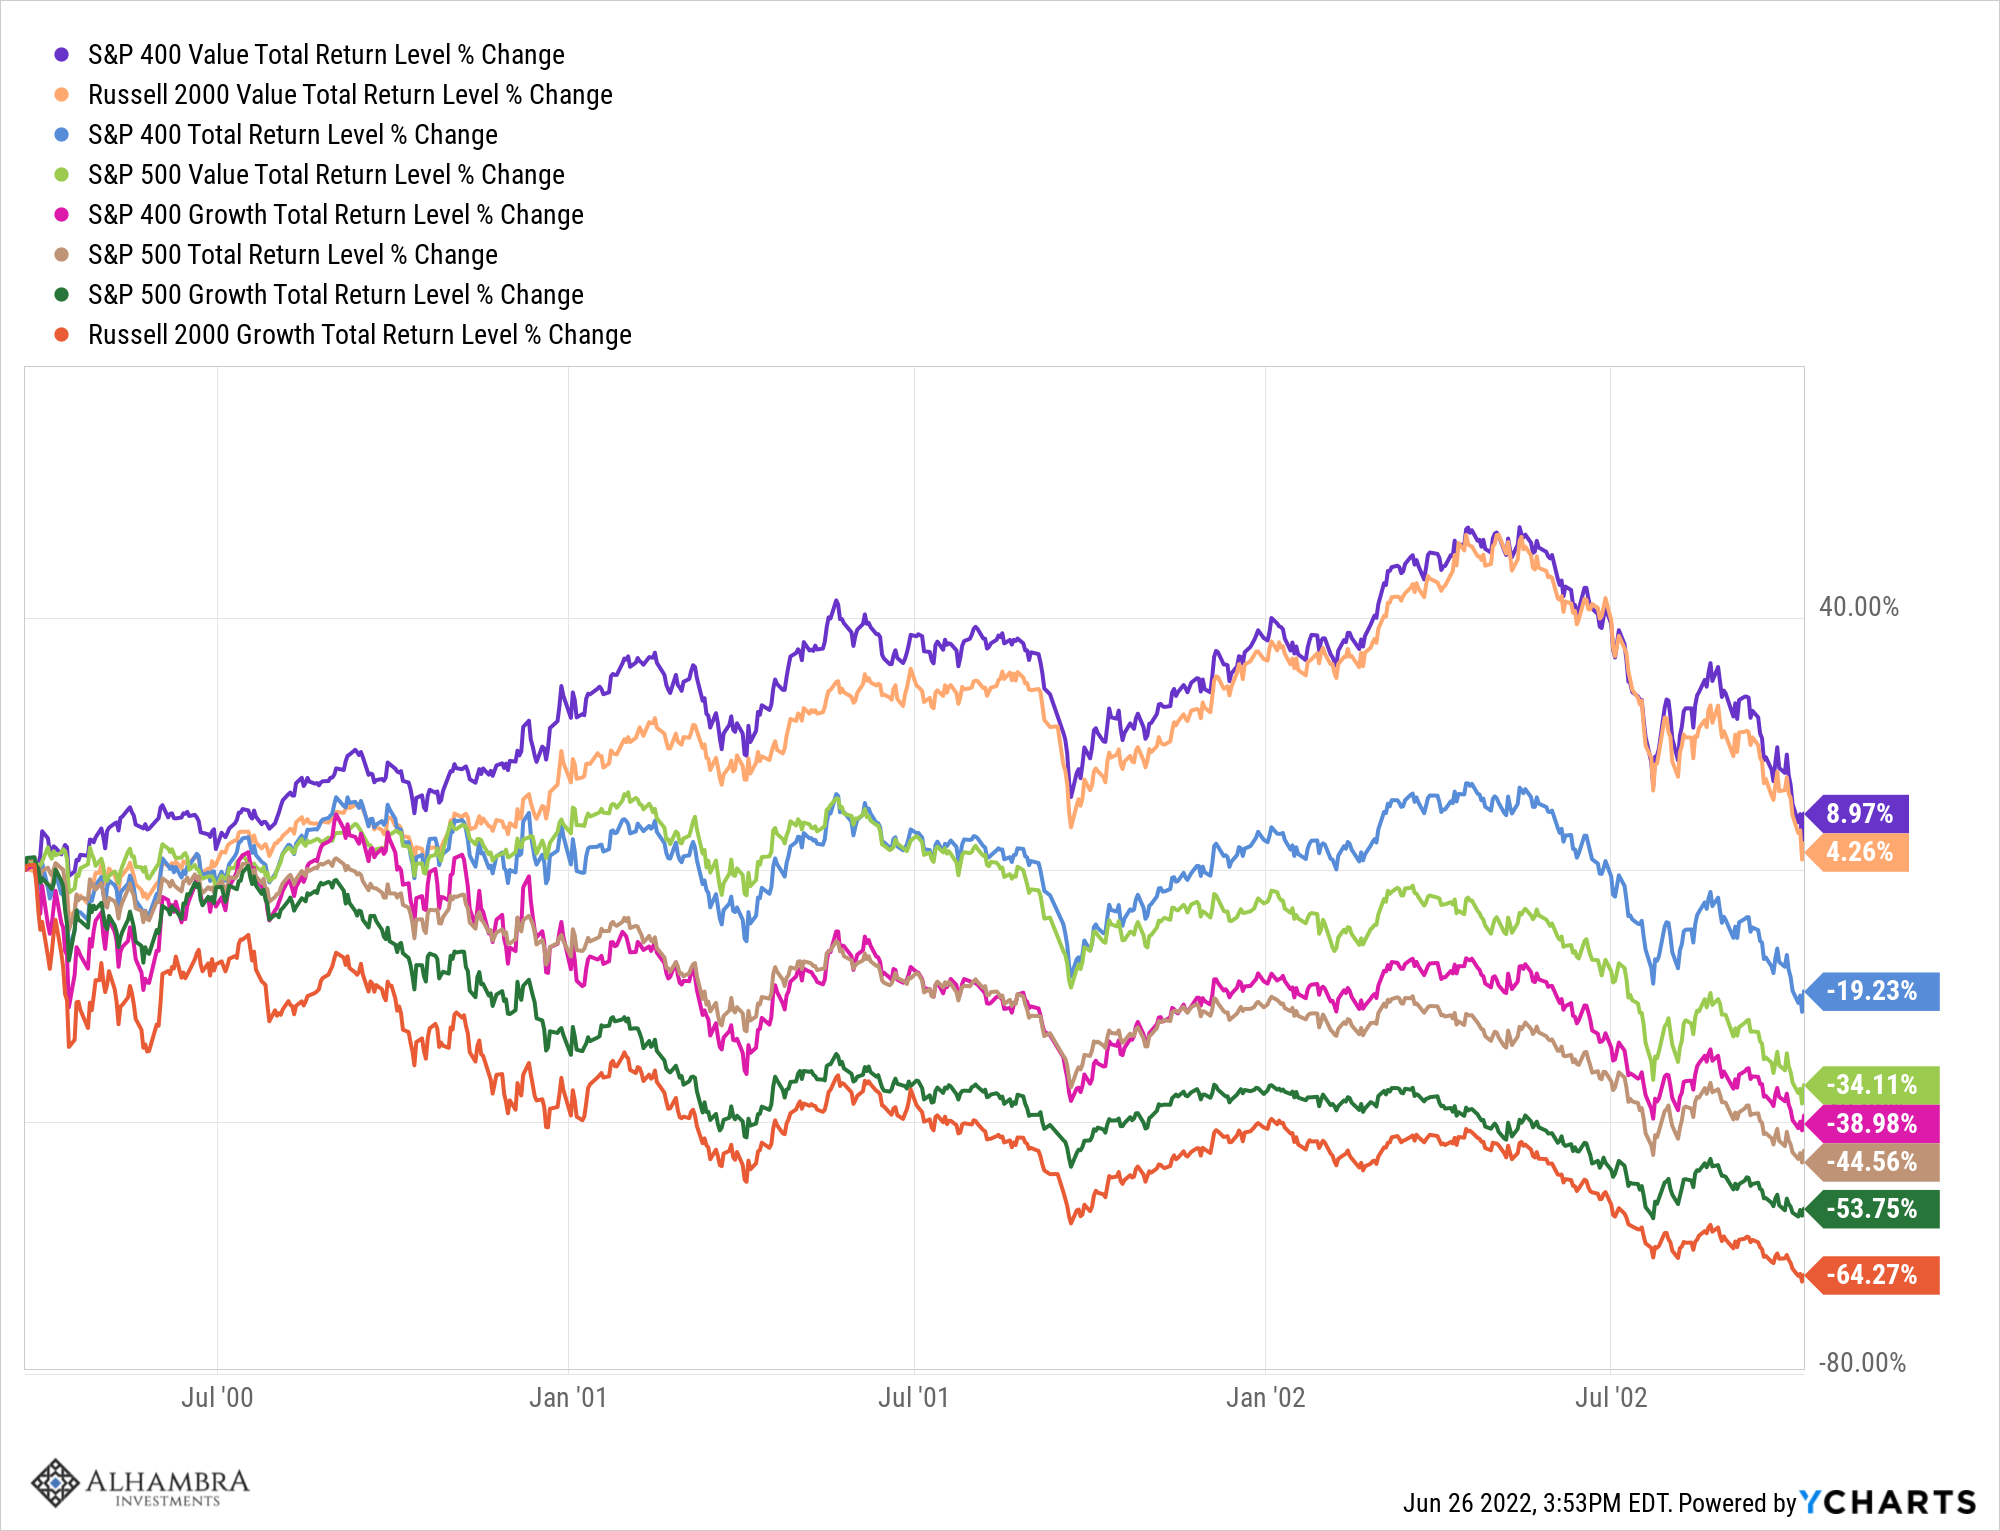 . |
Growth stocks were grossly overvalued going into that bear market and they took the brunt of the damage. The gains in small and mid-cap value were not large but they were positive. In addition, when the post 9/11 rally ended in May of ’02 both those indexes were up over 50% so you had an opportunity to book some profits before that last leg down.
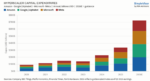
Value stocks weren’t the only thing going up in that period. Commodities also performed well up 49.7% in 2000, down 31.9% in 2001, and up 32% in 2002 (commodities are always volatile). After the US dollar peak in early 2002 commodities really took off, ultimately rising 290% from the beginning of 2000 to the peak in mid-2008. REITs were also up during the bear market, rising 37.3% from the 2000 peak to the 2002 bottom.
Gold was also up but just 10.8% over the entire period.
Diversified portfolios performed okay during that period but the difference between negative and positive was found outside the standard stock/bond combination. A moderate version of our strategic portfolio (the Fortress portfolio that includes Large Cap, Small Cap, REITs, Gold, Commodities, and Bonds) produced a CAGR of 3.13% over the 3-year period from 2000 to 2002 and that portfolio includes the S&P 500. The Fortress is a passive portfolio but even a minor tactical move away from growth would have raised those returns considerably. By contrast, the 60/40 portfolio of stocks and bonds (Vanguard Total Stock and Vanguard Total Bond) had a CAGR of -4.78% from 2000-2002.
Small and mid-cap US value stocks today are again cheap and unloved. Both have seen considerable fund outflows YTD and over the last year despite their outperformance.
The current characteristics of the S&P 400 midcap value index:
- A P/E of 12.5 with long-term earnings growth of 13.3%
- 0.87 times sales
- 1.7 times book value
- 9% of assets in the top 10 names with an average P/E of 11.8
The current characteristics of the Russell 2000 value index:
- A P/E of 10.8 with long-term earnings growth of 16.5%
- 0.93 times sales
- 1.35 times book value
- 6% of assets in the top 10 names with an average P/E of 7.2
These are not just cheap relative to large-cap but just plain cheap. No, it isn’t early 1980s cheap after a 16-year sideways slog for stocks, but it is cheap by just about any measure.
I’m not saying that markets today will exactly repeat what happened in the 2000-2002 bear market. No two market eras, no two economic environments are exactly the same. There is obviously no guarantee that the recession, whenever it arrives, will be mild like the one we had back then. But we also shouldn’t assume it will be 2008 all over either. In fact, history and common sense would suggest something between those two extremes. And just so you know, none of those useful recession indicators I follow are at recession levels. That doesn’t mean we aren’t slowing down and that recession won’t eventually come but it isn’t here yet. Based on the futures markets, the terminal peak fed funds rate is falling and the peak date is creeping closer, now in the first half of next year. You’ll note that isn’t within the next six months. Could the slowdown accelerate? Sure and recession could arrive before the end of the year but even if it does, that doesn’t mean all assets or even all stocks will go down. Stay diversified and you’ll get through this. And if you stay away from the – still – overvalued and most risky parts of the market, you should do that much better.
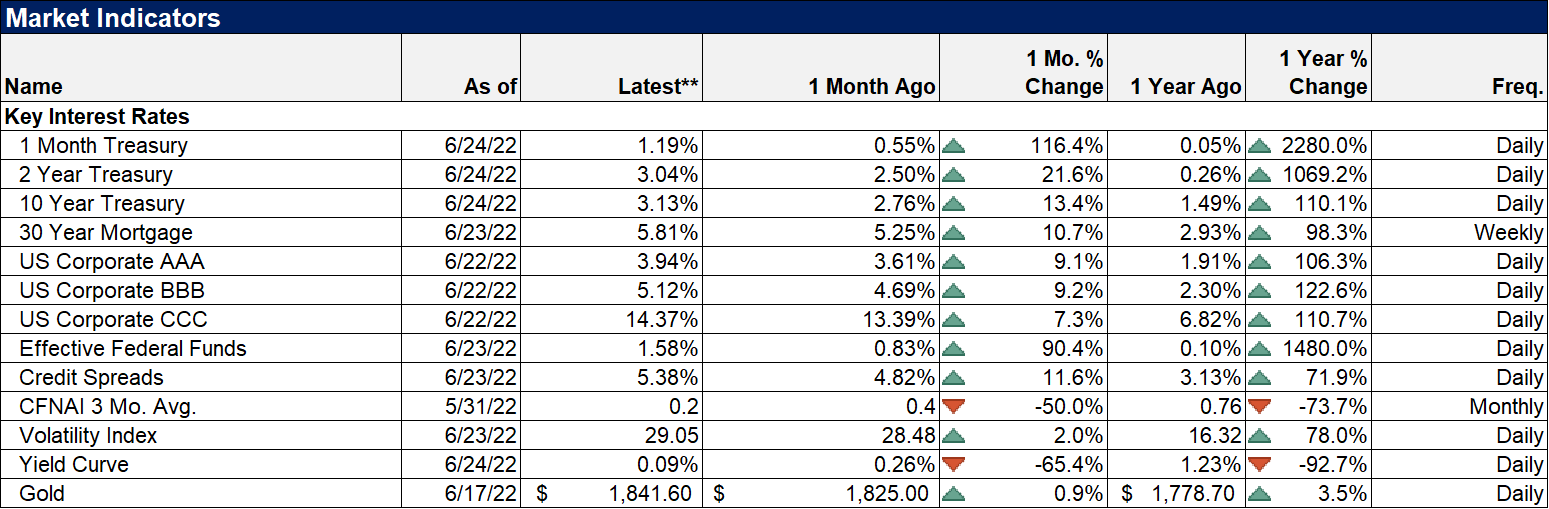
| The uptrend in rates and the dollar remain intact but both softened a bit last week. The 10-year Treasury yield hit nearly 3.5% immediately before the FOMC meeting and traded down to nearly 3% last week before closing at 3.12%. The volatility in Treasuries has been truly stunning this year. It will be interesting to see how that changes with QT. The dollar was also down last week but, in contrast with Treasuries, the daily range has been narrowing recently. I have no idea if that means anything or not but I’ve been doing this long enough to know that low volatility is always followed by the opposite. And with everyone expecting the Euro to decline….
10-year TIPS yields also fell last week but less than nominal rates; inflation expectations continue to fall. 5-year, 10-year and 5-year, 5-year forwards all show inflation expectations under 3 and within the range that has persisted since 2003. Yes, the top of that range but within the range. Forget the Fed and what they might do. Inflation, inflation expectations, and rates appear to have peaked. |
 . |
| The rally in bonds last week spurred gains in stocks and real estate as well. Investors appear to be taking weaker economic data and better inflation data as an indication the Fed will moderate its rate-hiking path. As I’ve said before, I don’t think whatever the Fed thinks it will do makes any difference; markets dictate policy not the other way around. If the market perceives recession as the likely outcome, short and long-term rates will fall. And if history is a guide, short rates will fall faster than long rates, steepening the yield curve in the process. But that wasn’t what last week’s move was about. It was just the entire curve shifting lower after an overshoot to the upside.
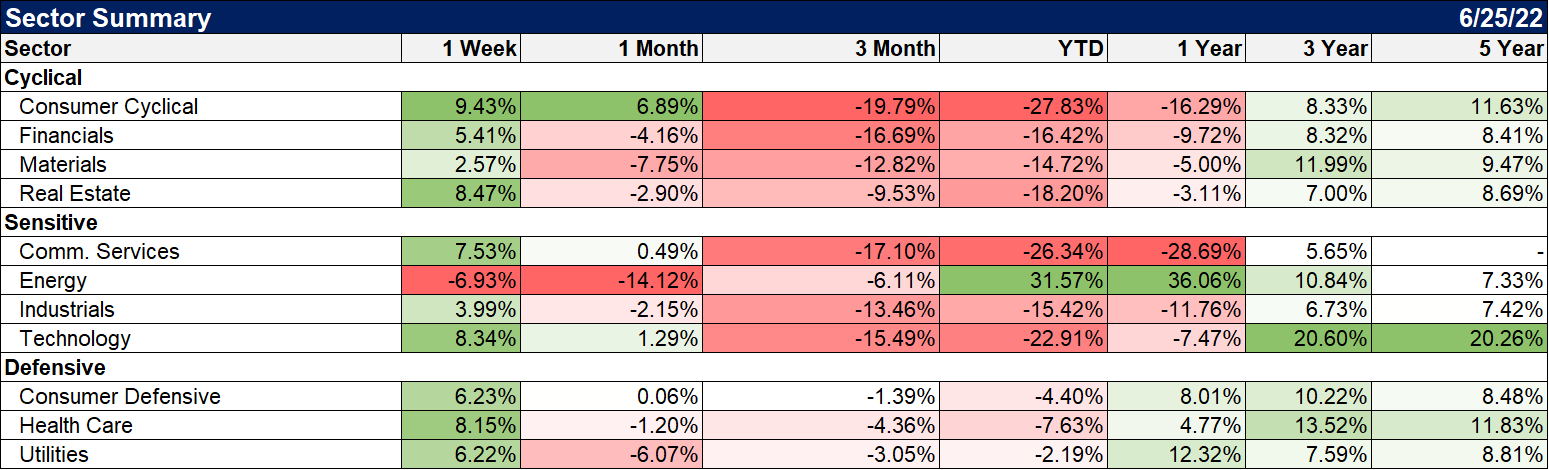
Commodities took another hit last week and sentiment has turned sour very quickly.A few weeks ago, everyone wanted energy stocks and now everyone is rushing to get them out of their portfolio before the end of the quarter. The commodity indexes actually haven’t done anything since early March and the correction probably isn’t over. Like everything else in markets these days, the commodity rally went too far, too fast. Getting back to an intermediate uptrend line means about another 17% drop from here and a total correction of roughly 25%. And we’d still be in a well-defined uptrend. Let me repeat what I said above – commodities are volatile. They are also a necessary component of a diversified portfolio. Growth outperformed last week but value still holds a large lead YTD and over the last year. China continues to recover despite all kinds of bad news. There’s a lesson there about investing. I’ve said it so often that people around here are sick of hearing it but, one more time, the market is not the economy and the economy is not the market. |
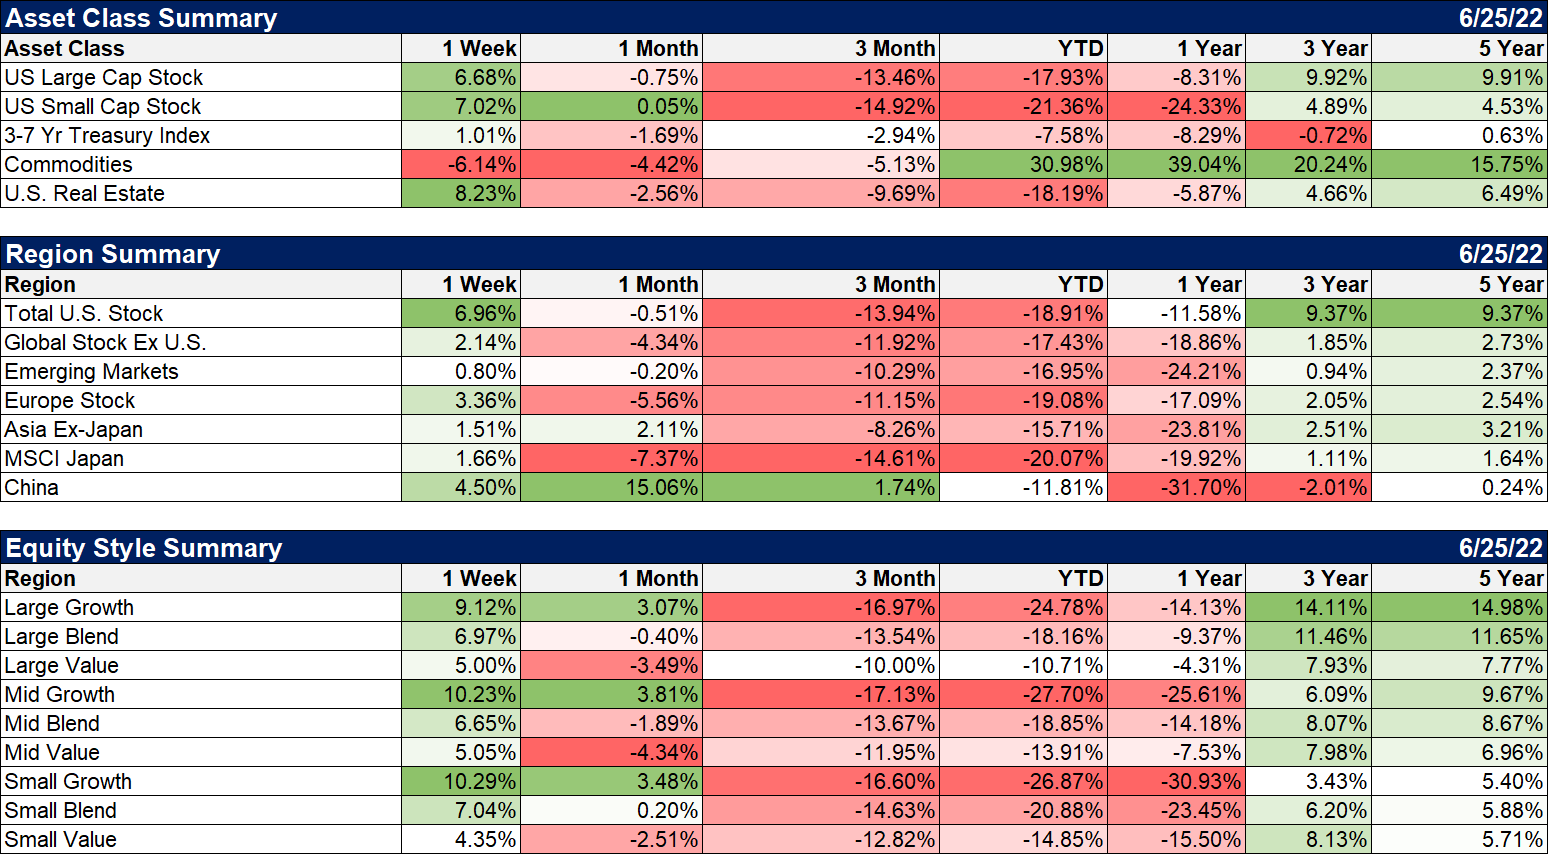 . |
| Real estate did well last week with rates falling back but cyclicals were very oversold and got a big bounce. It will be interesting to see how those stocks react if the economic data continues to deteriorate. If these stocks hold up in the face of weaker data, that will tell you something important. |
 . |
| People keep asking if the bear market is over but that’s the wrong question. First of all, all assets are not in a bear market. Yes, growth stocks most certainly are but large value stocks are not. Midcap value stocks are not. International value stocks are not. Real estate is not although it was briefly. Commodities are not. Gold is not. Even if the large growth stocks continue to fall, that doesn’t mean everything else will too. Convention says that you should have the bulk of your equity investments in large-company stocks but convention is not a suicide pact. You don’t have to own things that are obviously overvalued or too risky for your situation. Investors have for a number of years ignored fundamentals because they could. It didn’t matter what multiple of earnings you were paying for Netflix or Tesla. It didn’t matter if you bought companies that had no earnings as long as there was a plausible – or not so plausible in many cases – story about a bright future. It didn’t matter if you put most or all of your equity allocation in the S&P 500 or the NASDAQ. None of that mattered – until it mattered a lot. |
 . |
It is time to focus again on the fundamentals of investing. That means you need to know what you’re buying and what you are paying for it. It means you need to diversify across multiple asset classes so you aren’t dependent on one. It means not making big bets on one company or sector. It means being humble about what you do know and don’t know and can’t know. It means focusing on the present rather than trying to predict a future you can’t possibly see. Expand your horizons and find the investments that make sense today. They’re out there. All you have to do is look.
Full story here Are you the author?Tags: Alhambra Portfolios,Bear Market,Bonds,commodities,crypto,currencies,earnings,Featured,growth stocks,Interest rates,Markets,newsletter,Real Estate,S&P 500,small cap stocks,stocks,TIPS,US dollar,valuations,value stocks