I’ll just get this out of the way right at the beginning. The question in the title of this post refers to the end of the ongoing stock market correction and the answer is likely no. There are no sure things in this business so it isn’t an unequivocal no, but based on history, the odds favor more weakness. I know a lot of people liked that rally into the close on Friday and it was a nice way to end a wild week but it also shows that traders/investors are all too willing, able and anxious to buy the dip. It is probably true, as I heard someone say last week, that with the Fed meeting over, the market will focus more on fundamentals now but that may just introduce a whole new set of problems.
We’re in the midst of earnings season and Q4 2021 is so far tracking as the 4th consecutive quarter of 20% + earnings growth for the S&P 500.
The last time that happened was from 2009 to 2010 coming out of the 2008 crisis; big earnings growth coming out of a recession is not a surprise. But when we look at what has been reported so far, it appears that analysts are rapidly catching up to reality which isn’t particularly good news. About 1/3 of the companies in the S&P 500 have reported as of last week and 77% are beating earnings estimates which is slightly above average. And roughly 75% of those companies are reporting revenue above consensus too which is also above average. The problem is that, on average, companies are beating earnings estimates by just 4% while the 5 year average is over 8%. Revenue is beating by 2.5% which is above the five year average so that isn’t the problem. It is on the cost side that things are getting derailed; margins are not as good as expected. Earnings season still has a long way to go so maybe that will change but it shouldn’t be surprising given the price and wage hikes of the last year.
Full calendar year earnings growth for 2021 is going to clock in around 45% so it was a good year for sure and that goes a long way to explaining the good returns for stocks last year. But that isn’t sustainable and the rate of earnings growth was obviously falling in the second half of 2021 and is set to fall further in the early part of this year. Current earnings growth estimates are 5.6% and 4.3% for Q1 and Q2 2022 respectively. I think that also assumes continued strong growth from the economy – if less than last year – so there is more than a little uncertainty around those estimates. Wall Street analysts are notorious for missing the turn in earnings – up or down – so the smaller beat margin this quarter is worrisome to say the least.
But earnings were not really the focus last week or the trigger for this correction so it may be that we get a recovery of at least part of this recent selloff. Even if this is the beginning of a bear market – and we have no way of knowing if that is the case or not – rallies should be expected. The 2000 market peaked on March 24th, 2000 at an intraday high of 1553.11 (S&P 500) and quickly fell 14% to the intraday low of 1339.4 on April 14th. Over the next 5 months the market fluctuated in a wide volatile range and by September 1st reached to within 1.5% of that all time high set in March.
The 2007 top and subsequent bear market was similar with the S&P 500 peaking in October of 2007, falling a quick 10% and getting a lot that back by December. There was a further fall into March of 2008 that took the average down by 20% intraday top to bottom. A nearly 15% rally followed before things really went south. Big rallies are normal in bear markets.
| Another thing to note is that both of those bear markets were associated with recessions but that hasn’t always been the case. About 70% of bear markets are associated with recession but most recently (relatively) we had bears in 1961, 1966 and 1987 with no recession. So, even if you assume the economy stays out of recession this year, that doesn’t mean you can’t have a bear market. And frankly, as overbought as this market was before this bout of selling, it wouldn’t surprise me in the least.
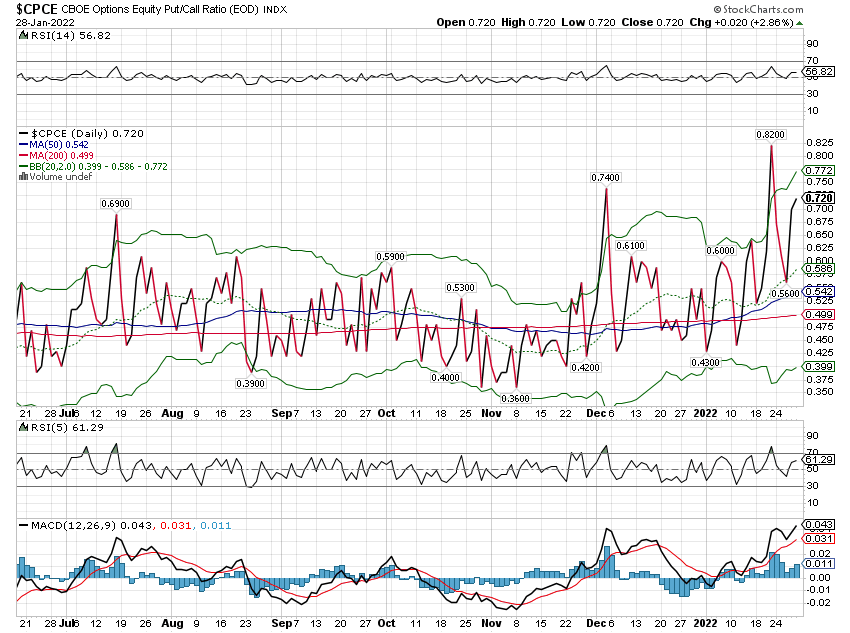
Anyway, back to last week’s action, which was pretty extreme especially on Monday. The range for the S&P 500 was 4.4% and the NASDAQ 5.6% just on Monday. The selling was concentrated in the morning and the buying in the afternoon with both indexes recovering all their losses by the close. Coming back from that deep a loss intraday is rare. The last time it happened was October of 2008 so don’t think it means the all clear has been sounded. And indeed the market was volatile for the rest of the week before closing up a fraction of a percent. What we didn’t get in my opinion is enough fear to say that was the bottom of this correction. There was a lot of retail put buying on Monday and that is a good sign but put/call ratios actually ended the week lower than the previous week. The equity only ratio is at 0.72 and usually reaches over 1 at bottoms. The correction in late 2015 saw the ratio reach 1.21, the December 2018 correction got up to 1.13 and in 2020 it reached 1.28. The index option ratio shows even more complacency, finishing the week at 1.19. That isn’t even high enough to get a day-trader excited. Which is why I say we probably have more to go on the downside. |
|
| I don’t want to be too negative because there are some indications that we’re getting closer, especially in the NASDAQ. The percentage of stocks above their 200 day moving average fell to 14.2 last week which is very close to previous bottoms. Like I said last week though, the S&P reading of this indicator is still well above what I’d expect at a bottom.
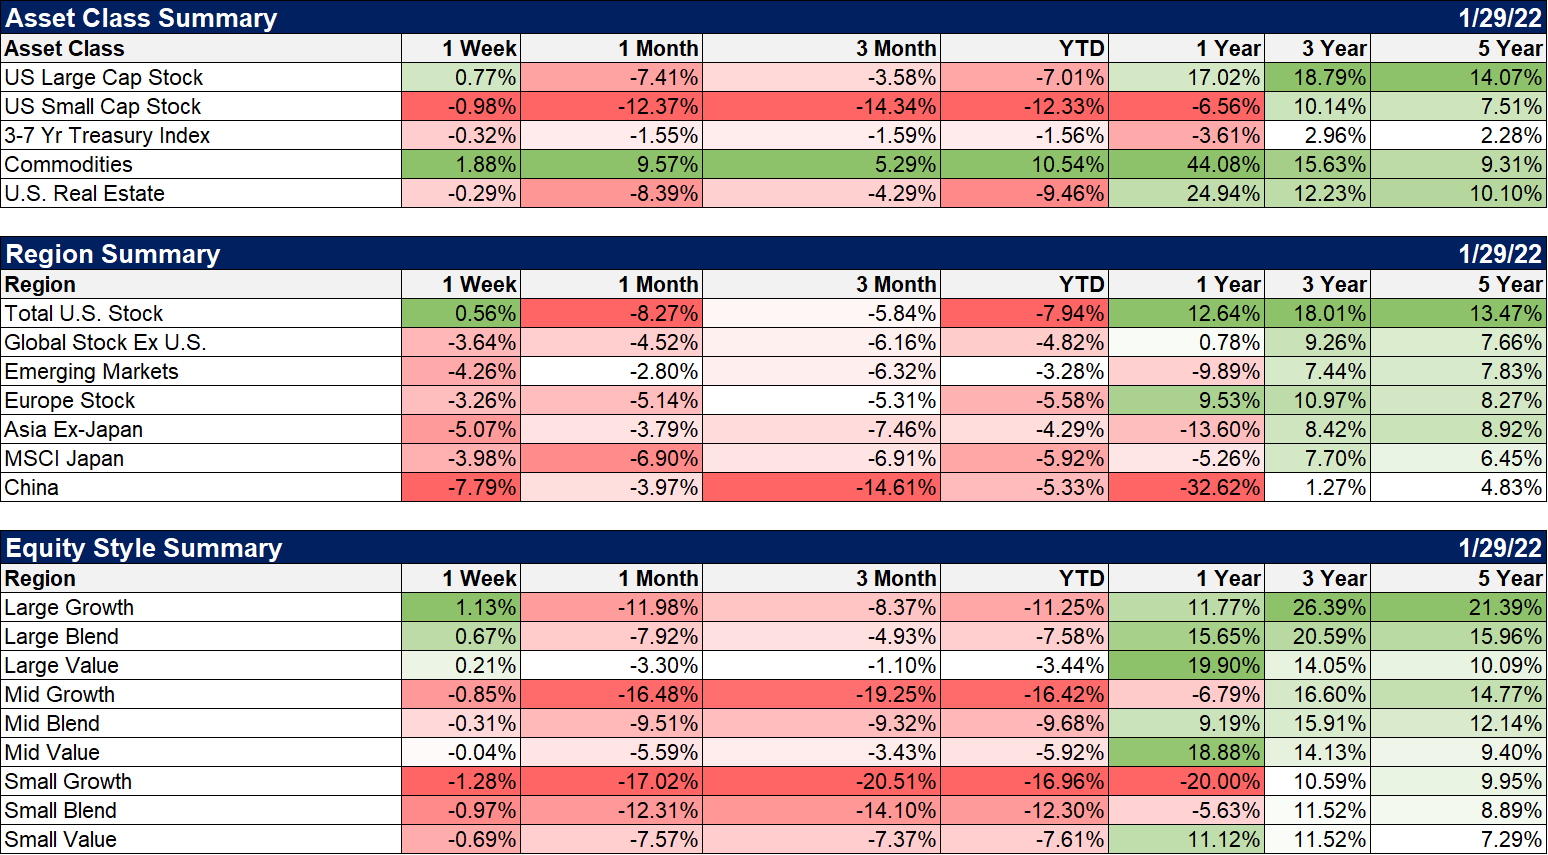
The volatility index (VIX) also ran up to near 40 on Monday which is closer to bottom territory but if this is going to be a full correction (S&P close down more than 10%), I’d still expect to see mid-40s at least. Large cap US stocks did manage to close in the green last week but most international markets were closed when the US market made its late day Friday recovery so they were all down. We’ll see if they play catch up Monday. Commodities continued their incredible run, closing up again and now up double digits for the year. Emerging markets took a pretty big hit last week because of China’s continued weakness and the dollar’s renewed strength (more on that below). The commodity rally kept Latin America in the green but Asian stocks were mostly down. |
|
| Energy continues to drive higher with crude oil prices but I wonder how much of that has to do with Ukraine. If that situation is resolved, energy stocks could take a big hit. | |
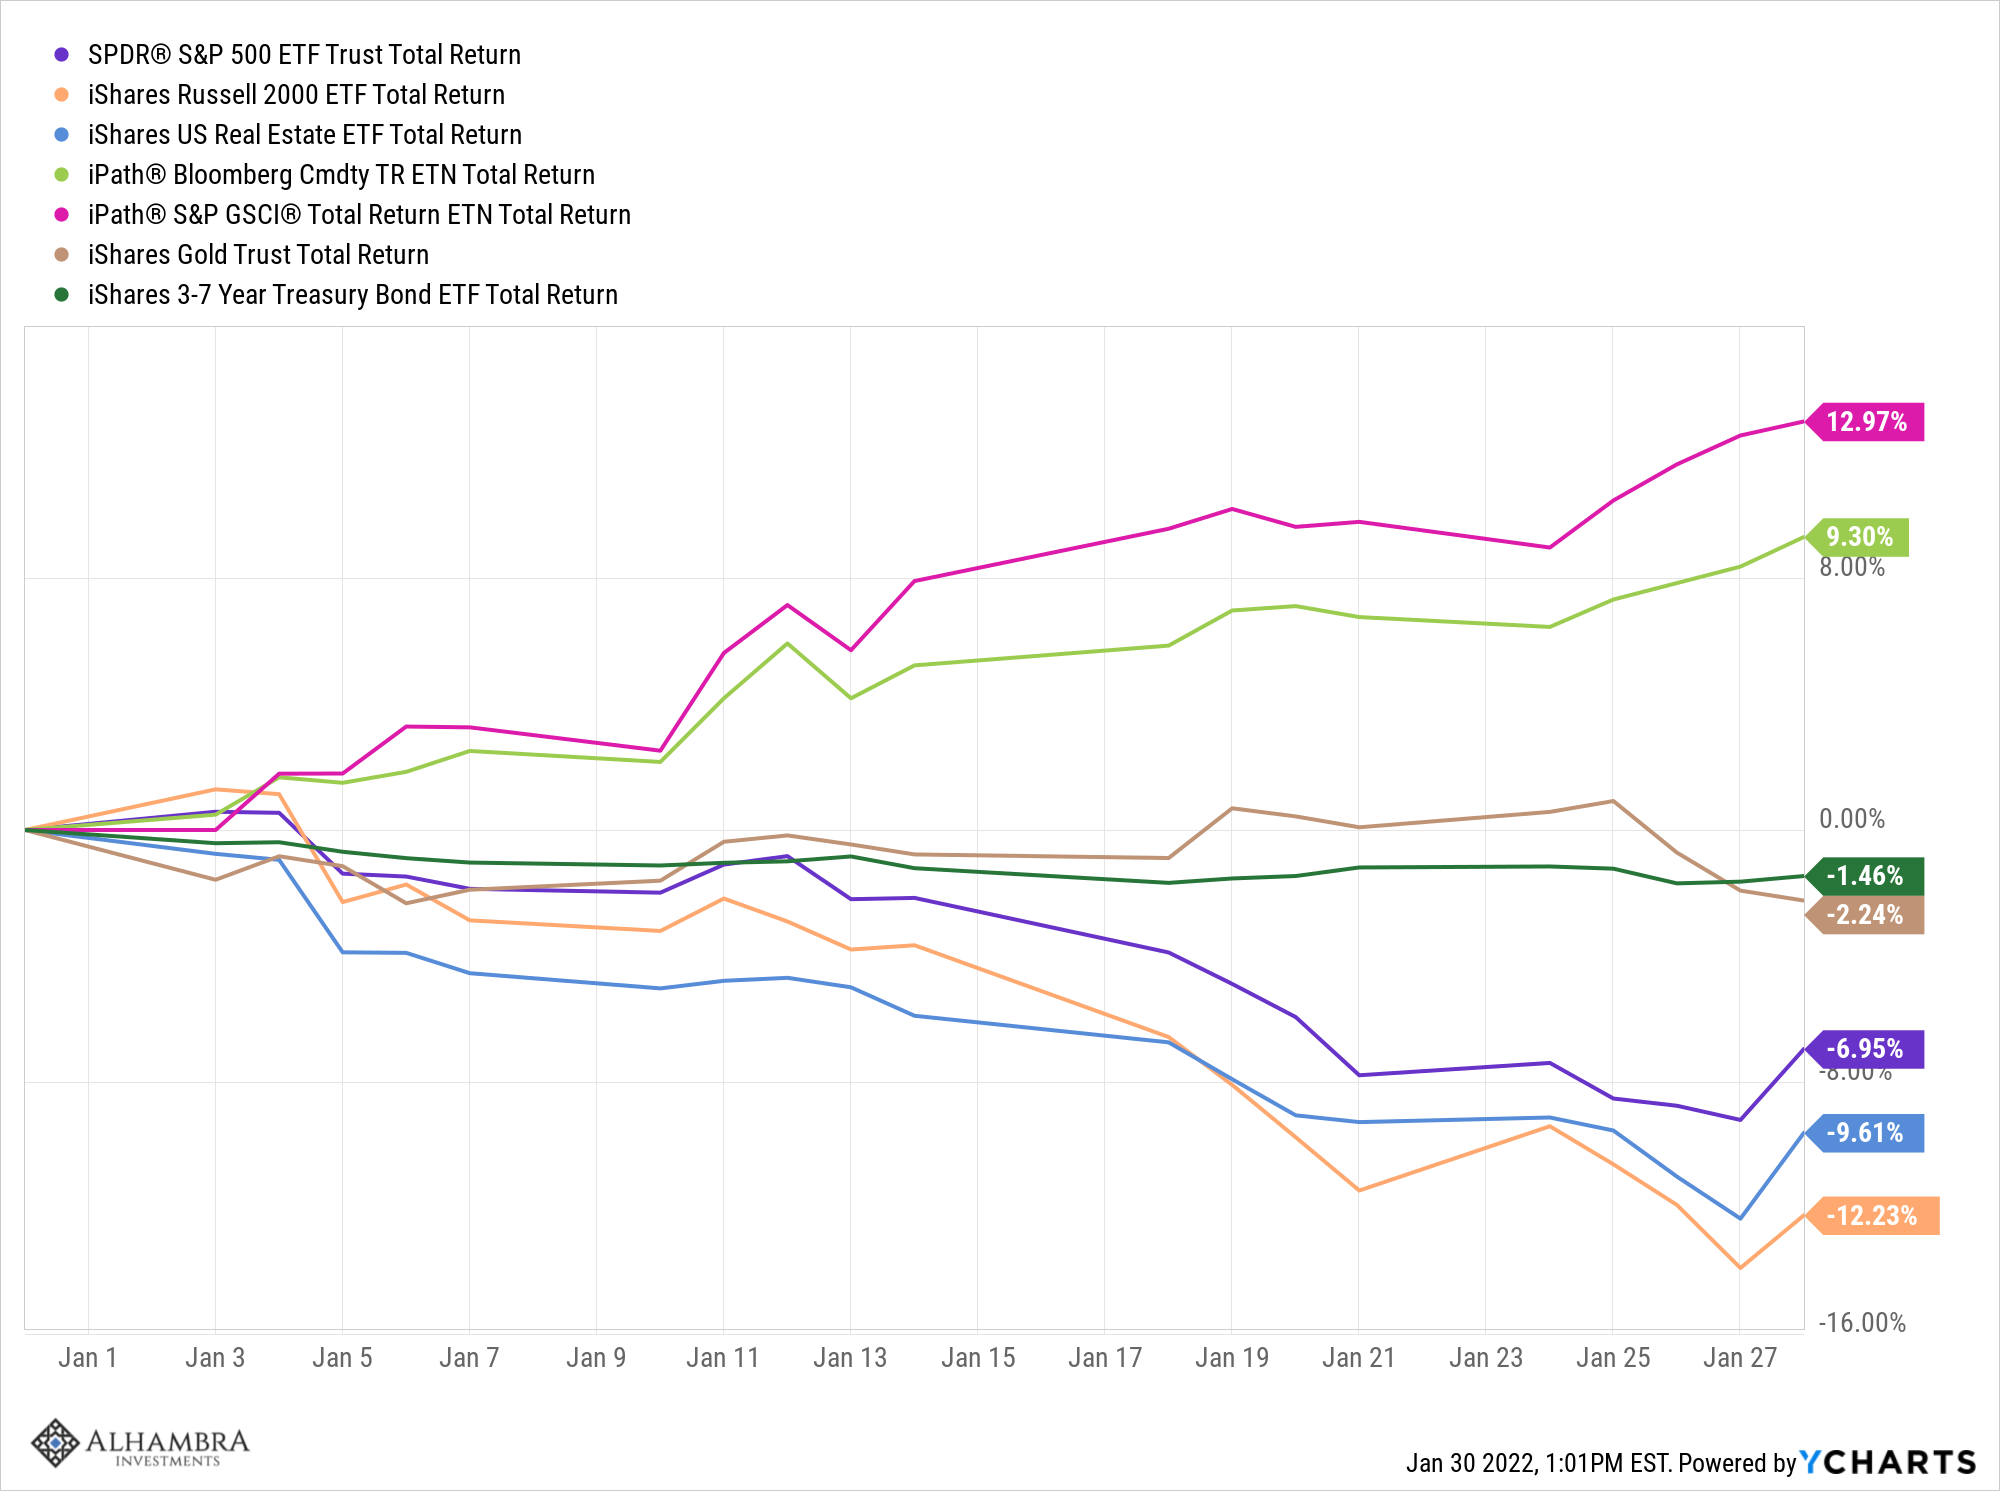
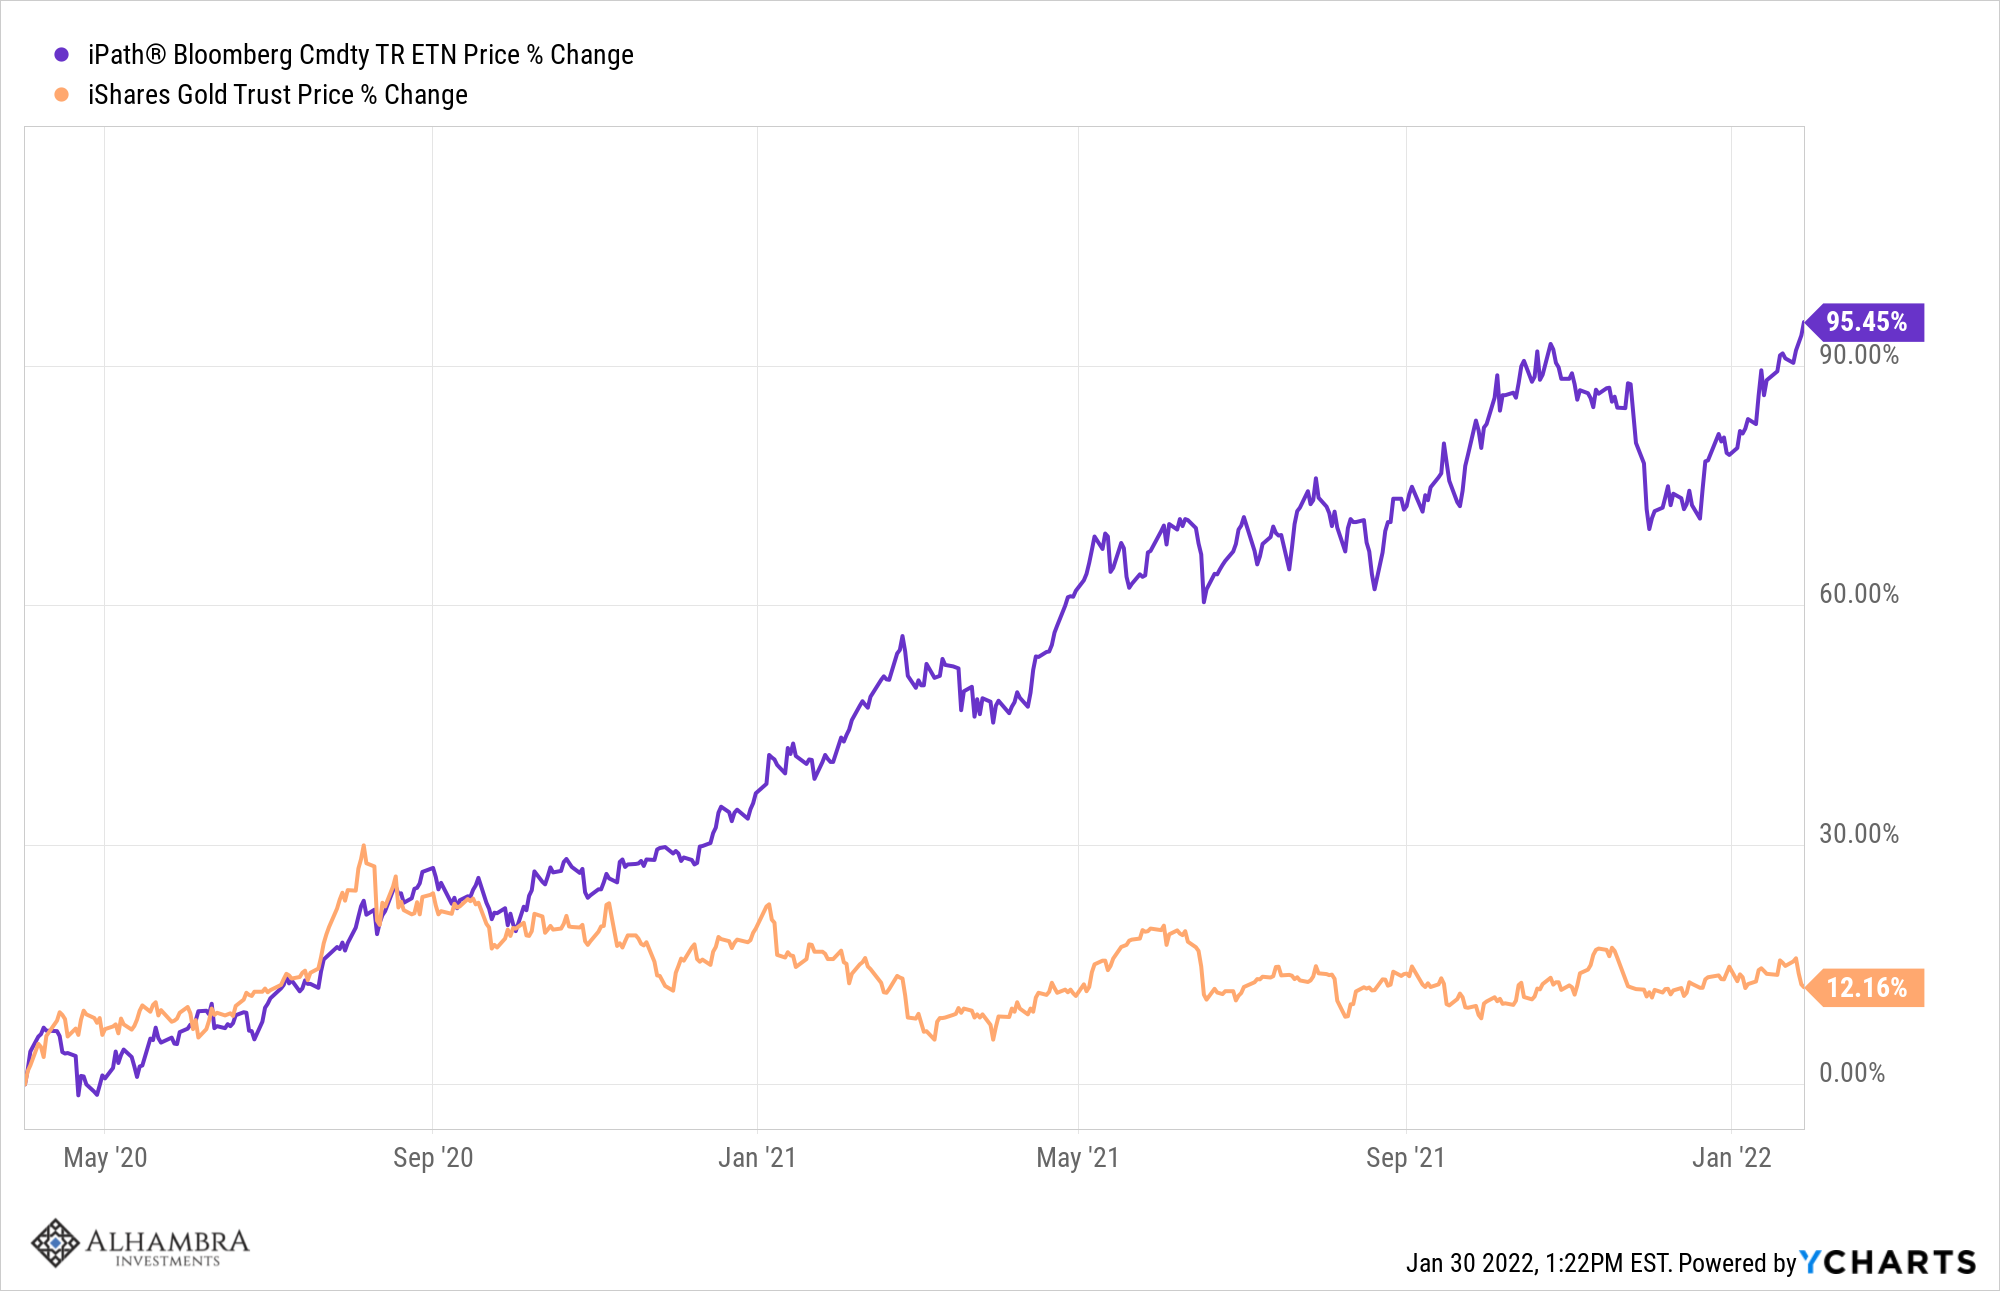
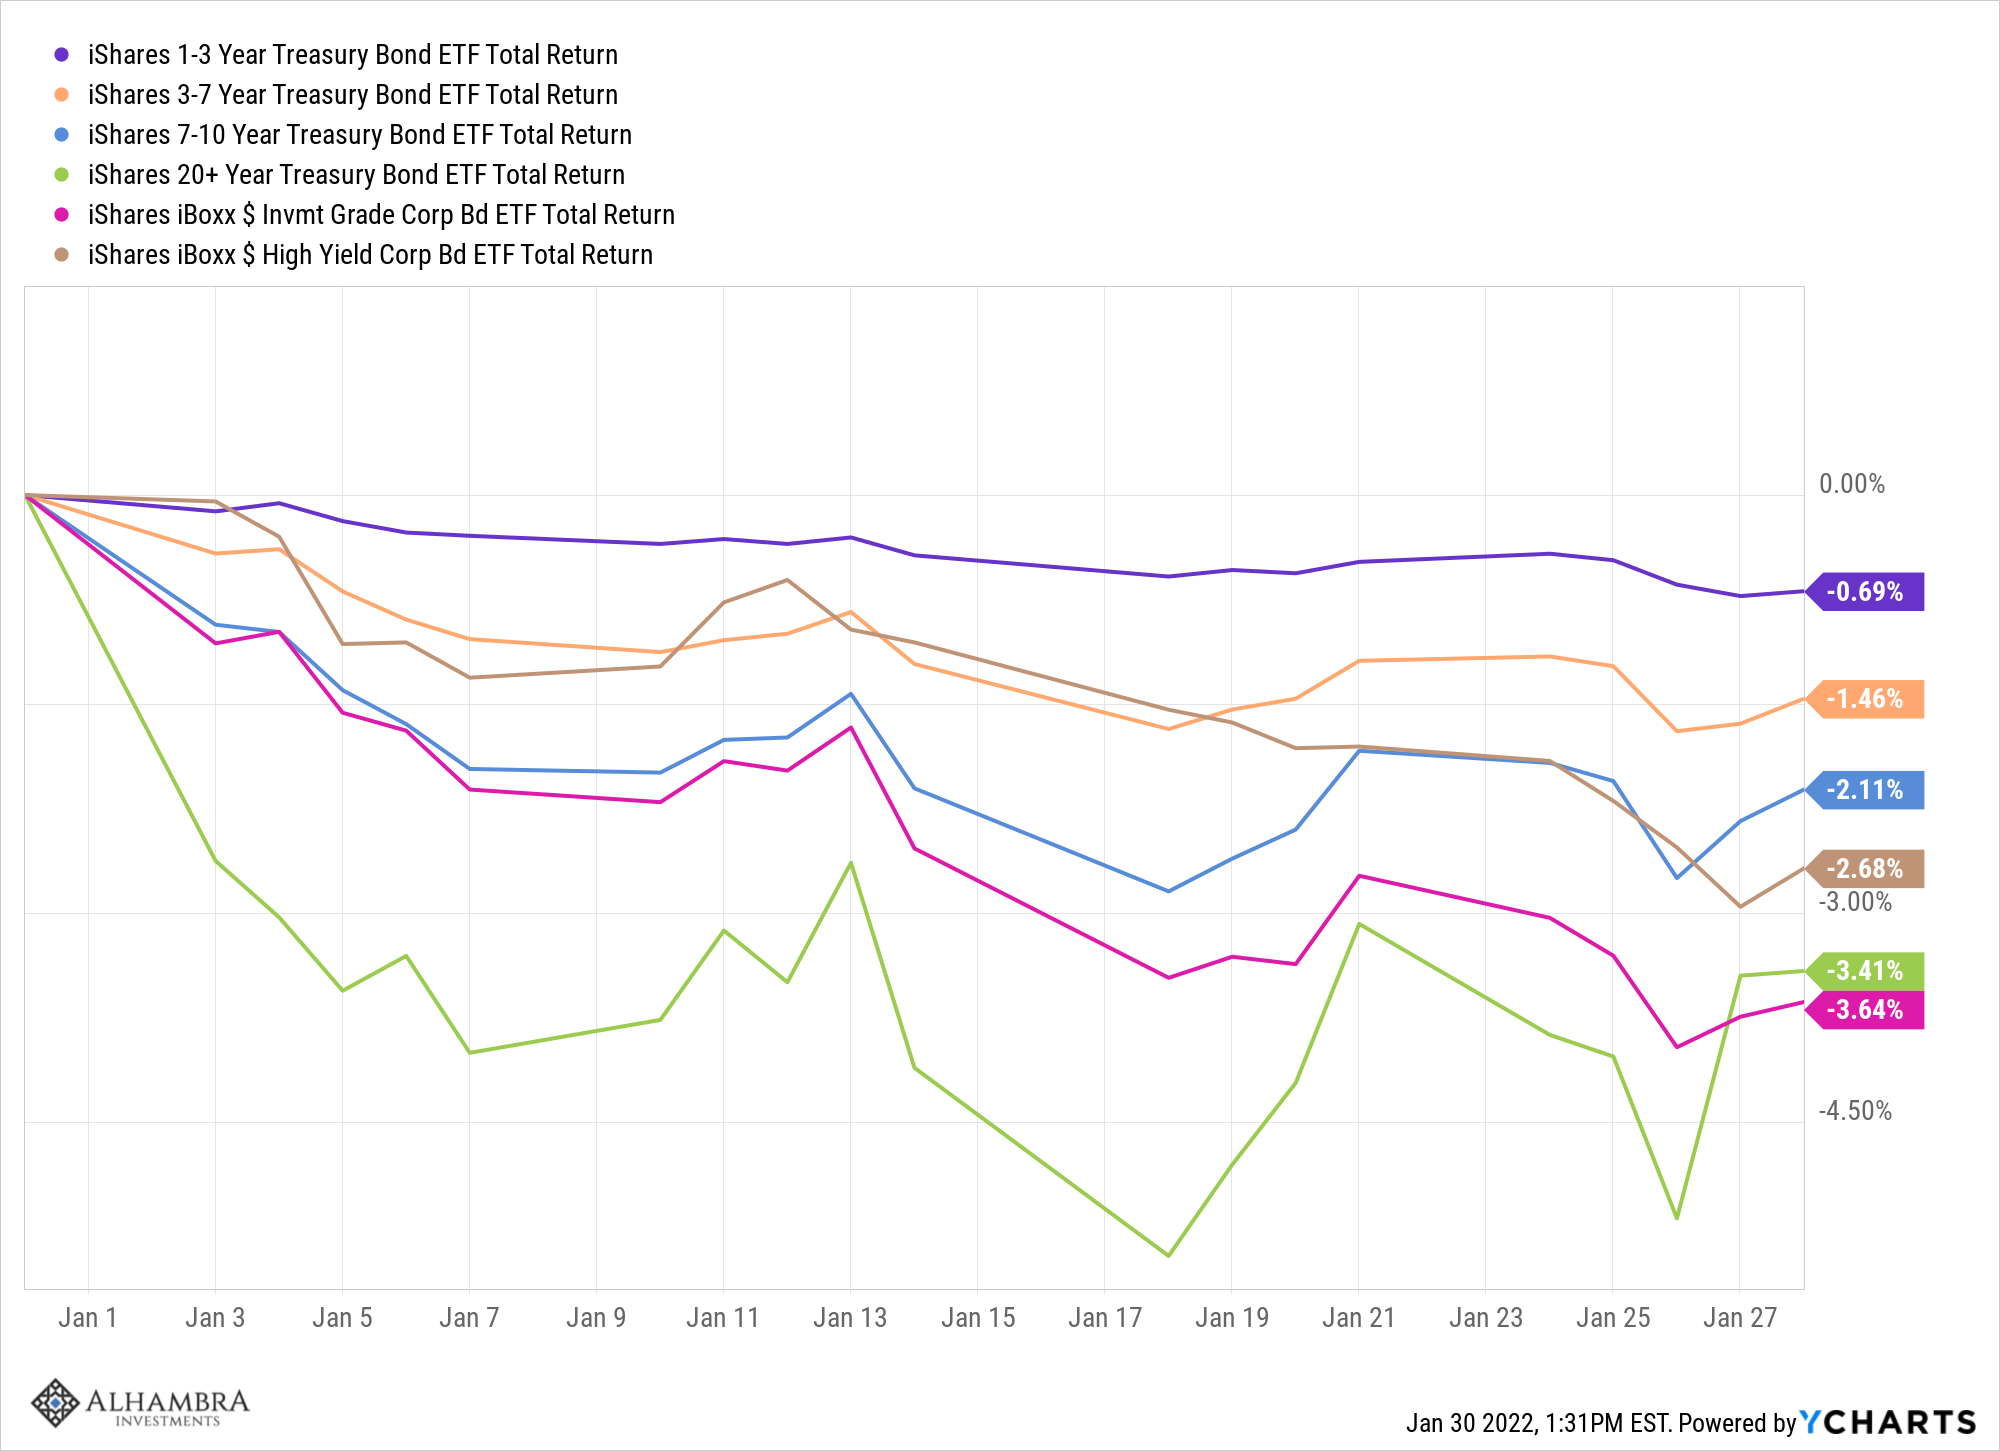
| Commodities are a big reason diversified portfolios are outperforming this year. There are two general commodity ETFs listed in the chart below, one based on the Bloomberg Commodity index and one on the GSCI. The GSCI is outperforming because it has a higher weighting in energy. Gold and bonds are down but only by a small amount while stocks and REITs are lagging. | |
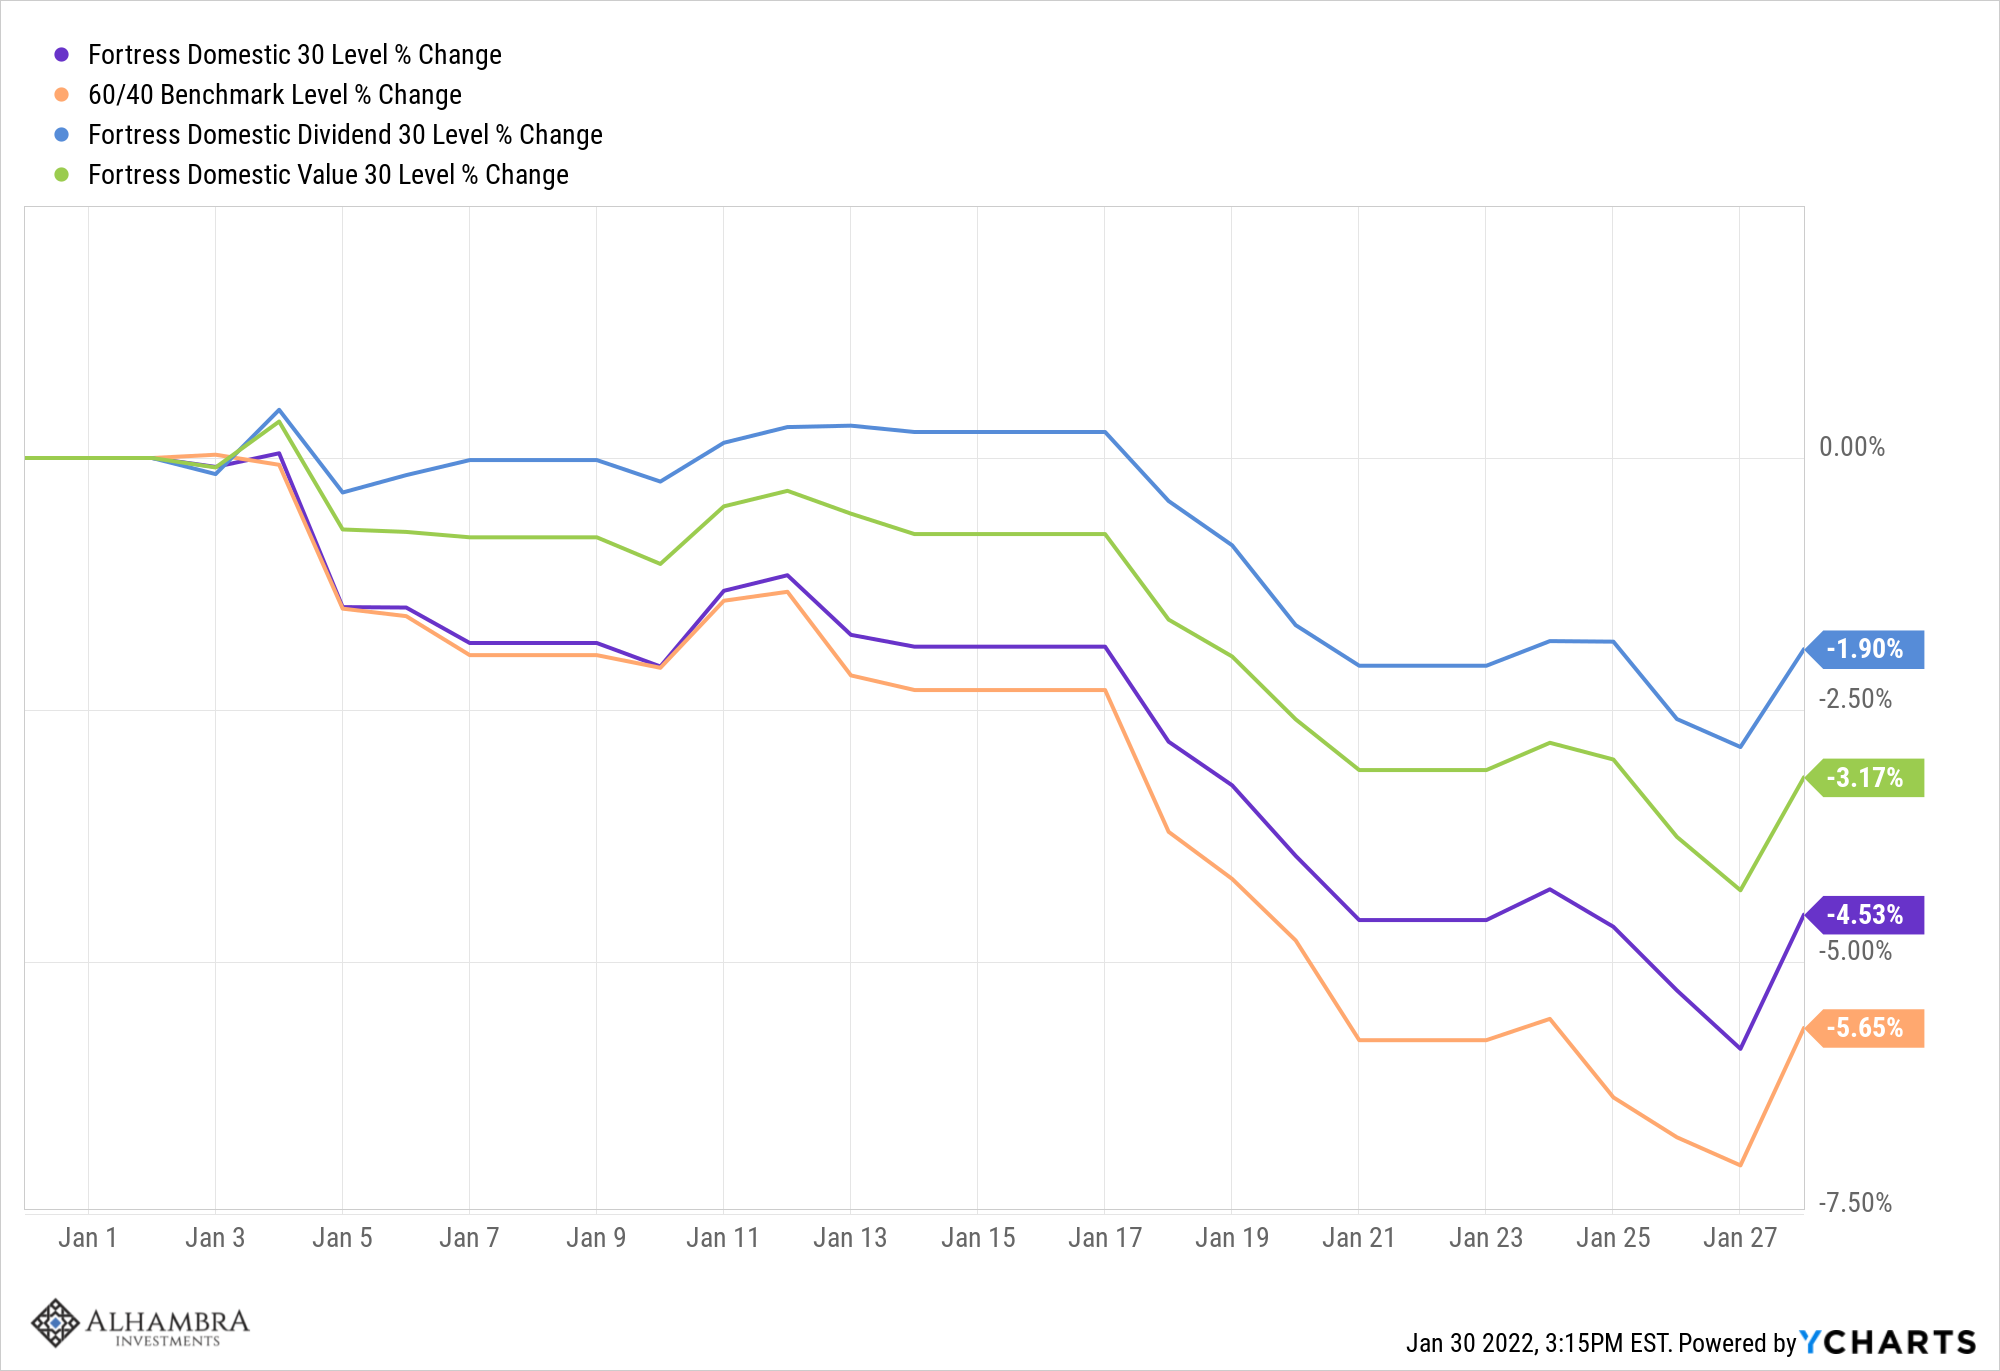
| We combine multiple asset classes into portfolios for exactly this reason. Below is the performance of several of our strategic allocations year to date versus the standard 60/40 portfolio: | |
| If you want to learn more about our approach to portfolio management, click here to contact us.
Interest rates continued to climb last week as they have for some time. The 10 year yield is up over the last 1,3,6,9 and 12 month periods. The yield curve flattened last week and its rate of change is essentially the inverse of the 10 year yield, down over 1,3,6,9 and 12 months. Credit spreads have widened only slightly during this sell off. We generally expect them to rise substantially before recession so that is a comforting sign. The CFNAI fell to -0.15 in December, indicating that growth fell below trend. |
|
|
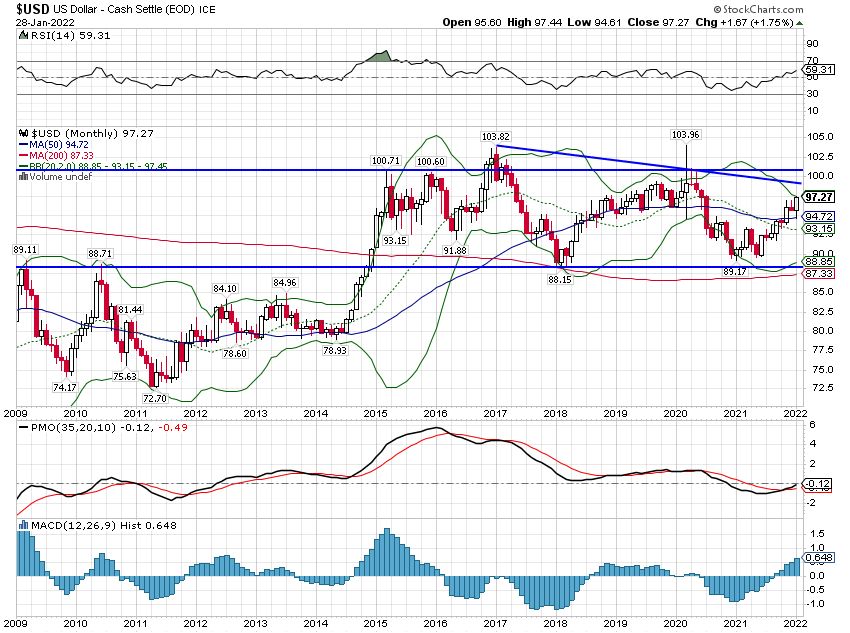
But the 3 month average is still 0.33 which is not worrisome and another indication that recession isn’t the worry here. Well, that short term downtrend in the dollar didn’t last long. |
|
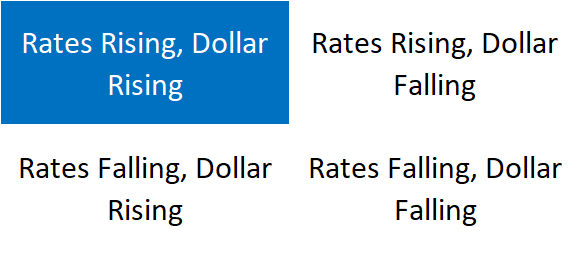
| Whether it was the Fed’s alleged hawkishness or the mess with Ukraine and Russia I don’t know. But whatever caused it we’re back to rising rates and rising dollar. I had initiated a small Emerging market equity position based on that short term downtrend but I’ll probably have to unwind that now. That’s why our initial positions are always small until a trend gets well established. If the trend changes quickly – as it did here – it doesn’t have a big impact on the overall portfolio. I still don’t think there is any reason to think the dollar index will get out of the range it’s been in for so long, but the trend is up and we have to acknowledge it. | |
| Rising rate environments cause us to make shifts to our portfolios. One of those shifts is that in a rising rate environment we favor the general commodity indexes over gold. The difference in performance is pretty stark as you can see. However, this trend is quite stretched and we are on the lookout for a trend shift in rates (especially real rates). If rates start to fall, we would shift from under to overweight gold. But we aren’t there yet.
|
|
| The rising rate environment also dictates the composition of our bond portfolio. The yield curve is flattening now and I’ve been asked by a number of clients if we shouldn’t be buying bonds in anticipation of recession. The answer is at least not yet. The current flattening is called a bear flattener which just means the yield curve is flattening with rates rising. A flattening yield curve is still a flattening curve and does generally mean that future growth will be lower but when is important. Every cycle is different and this one more than most but the correlation between today’s yield curve and future growth peaks at around 30 months in the future. With the yield curve peaking at a lower level than the last few recessions, that may not be true this time.
But until rates start to fall – this changes to a bull flattener – the proper choice is to keep the duration of your bond portfolio short. And that’s what we’ve done. |
It has been a challenging start to the year and it will probably remain volatile until we get some clarity on growth, inflation and the course of the Fed. Some of the commentary after the Fed meeting last week bordered on the ridiculous. One major bank predicted the Fed would hike rates 7 times this year. I know anything is possible but with economic growth already moderating that seems highly unlikely. And I find it hard to believe the price hikes will continue at the pace of last year. With so much of Q4 GDP a function of inventory building (see Jeff Snider’s comments here) it seems more likely that we start to see prices come back down in some categories.
With recession probabilities still pretty low, I don’t think big portfolio changes are warranted right now. Diversification should be sufficient to get us through this correction or whatever it is. We have cash on hand and when the time seems right, we’ll put it to work. In the meantime, patience is a virtue.
Full story here Are you the author? Previous post See more for Next postTags: Alhambra Portfolios,Bear Market,Bonds,cfnai,China,commodities,credit spreads,currencies,earnings,economy,Emerging Markets,energy stocks,Featured,Gold,Interest rates,Latin America,Markets,newsletter,Real Estate,Russia,stock market,stocks,US dollar,VIX,Yield Curve


