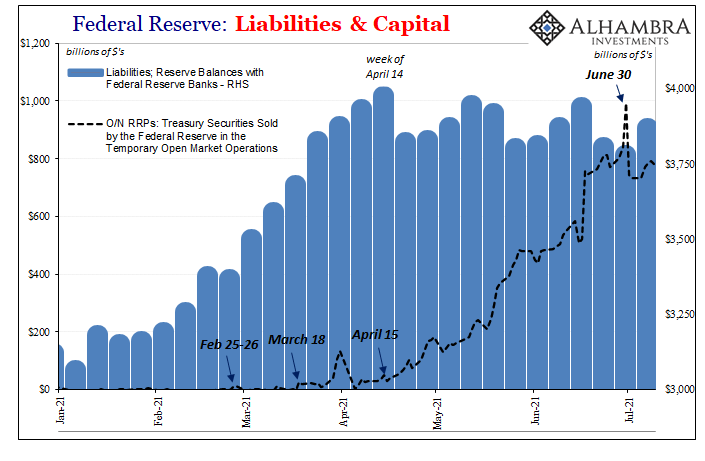
So much going on this week in the bond market, it actually overshadowed the ridiculous noise coming from the Fed’s reverse repo. Some maybe too many want to make a huge deal out of this RRP if only because the numbers associated with it have gotten so big. To end Q2 2021, financial counterparties “lent” just about $1 trillion to the Fed.
Holy cow! A trillion! There’s way too much money!
Eh.
The RRP, especially around its more informative margins, has little to do with too much money and almost everything to do with still too little collateral. The correlation with anti-reflation from bills to notes to bonds leaves little other interpretation. The latter matters so much more than the former, as proved so many times since Bear Stearns I couldn’t easily list them all (but I’ll note October 15, 2014 and May 29, 2018 because they were especially noteworthy).
| And if you have followed the RRP’s saga especially in its first week of Q3, you’ve already noticed that, yes, at the margins the RRP seems to rise and fall with the rise and fall in bill yields. While there is absolutely a glut of bank reserves (not to be confused with effective modern money) which has pushed financial counterparty demand for this Fed-sponsored outlet, that’s far from the only factor determining usage. |
Federal Reserve: Liabilities and Capital, Jan 2021 - Jul 2021 |
| To begin with, the raw data: the highest balance was recorded right on June 30, or quarter-end which sadly is entirely consistent with reporting period rhythms whereby it’s long since standard practice for banks and now non-banks, too, to hide as much risky activities as they can possibly get away with not reporting. Big jump in these “safe” classes at each quarterly interval, of which RRP qualifies.
Notice, however, that the RRP balance then drops not just way down from the June 30 top but even in comparison to late June before quarter-end. The average was $808 billion the final week of June (not including the 30th) but was only $772 billion over this past week. While $36 billion isn’t a huge difference, why isn’t it still going up (as some in the media have contested)? |
UST Yield Curve, Mar 2021 - Jul 2021 |
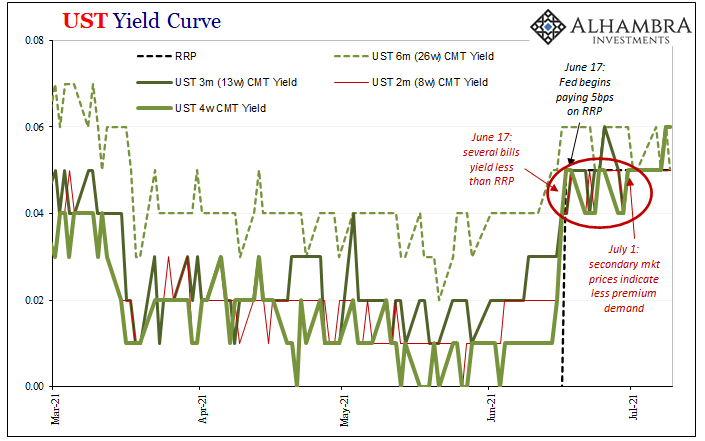
| Interestingly, for the collateral view, secondary market bill prices have normalized to the higher RRP payment scheme beginning right on July 1. In other words, still the same correlation as before only so far in Q3 there has been less collateral pressure (via overbid bill prices) and not coincidentally a bit less in RRP rather than continuously higher as has been predicted.
Some minor good news, perhaps, for a global bond market spitting out only bad of late (and that might actually be related to bill yields). This doesn’t mean, however, that all collateral strains have been eliminated in a rush of optimism and reflation; far from it. It’s just that, judging by the secondary market, the collateral-side imprint in lower bill yields has lessened to the point that, so far in July, most pricing services believe yields have stuck more closely to the RRP “threshold” compared to late June when they kept pricing below it (for obvious collateral-related reasons). |
UST Yield Curve, May 2021 - Jul 2021 |
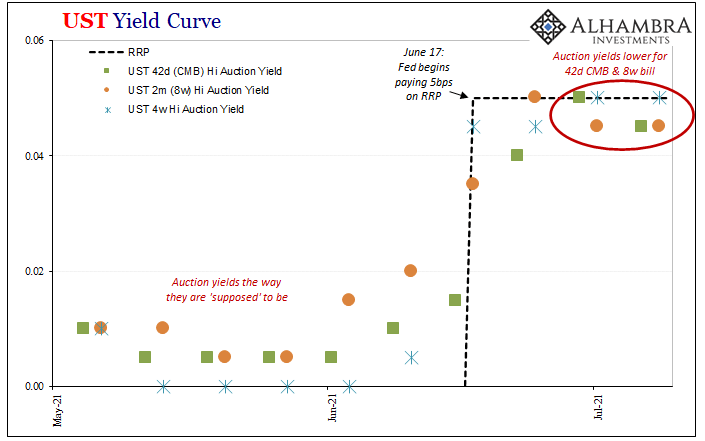
| But that’s just the secondary market, what about the primary market for bills which in many ways is more important? As discussed in more detail here, at bill auctions there’s a healthy sometimes majority demand coming from non-banks as much as dealers (indirect buyers in front end bill bidding isn’t from foreign participants, it’s instead these others such as hedge funds and the like).
This is where it gets even more interesting. At auctions, the high yields for the 4-week bill have been behaving, coming in right at 5 bps equivalent to the RRP (though median and low yields are less than it, so still the collateral bid). The next two bill maturities, the 8-week regular bill and the 42-day cash management bill (CMB), in the past few auctions they’ve priced to yield less than both the RRP and the 4-week! It isn’t immediately apparent why this would be, and this is a relatively new development (you can see above the hierarchy in yields “behaved” up until recently). While we can’t say for certain, we can reasonably speculate that the market desire for slightly longer maturity bills is indicative of equally reasonable lowered appetite for a 4-week instrument that has to be rebid every month (higher uncertainty as to availability?) Given the dearth of bills, collateral constraint, better to overpay for even slightly longer-dated instruments (regardless if that additional maturity is just 2 or 4 more weeks). So, primary market still shows collateral pressures even if they’ve attained another one of these monetary quirks that otherwise shouldn’t be there in a world oversaturated with useful money. The RRP, I believe, has shown itself even more closely associated to collateral circumstances than it had before last quarter’s end, while collateral circumstances have shown themselves to be on the one hand a little bit lessened in July while on the other a bit more screwed up. How does that balance out in the overall scheme of things? Maybe that’s where LT UST yields and global bond behavior all comes in. For one thing, these things really shouldn’t be happening, certainly not if too much money really was the global monetary system’s biggest problem at the moment. It so isn’t. |
UST Yield Curve, Jul 2020 - Jul 2021 |
Full story here Are you the author? Previous post See more for Next post
Tags: Bonds,collateral,currencies,economy,Featured,Federal Reserve/Monetary Policy,Markets,newsletter,Primary Market,reverse repo,treasury bills,U.S. Treasuries


