


| Since it’s sell-off from it’s early August high, gold has been stuck in an ever decreasing range.
Having had a remarkable rally to an intra-day high of $2,078 on the 7th of August Gold has traded sideways and consolidated. This has been viewed by many market commentators as a healthy pause in gold’s bull rally as when markets go parabolic they tend to retrace just as fast. The underlying rationale for owning gold has not change over the last month and some would say that it continues to increase. However, stock markets returned to their uptrend and gold traded sideways in an ever tighter range. It is once again testing the top of the short term range and a close above $1,975 could quickly see a retest of $2,000. However, a failure at these levels could set up a further retracement in the short term, which could test $1,910 or lower. |
Gold Tests Resistance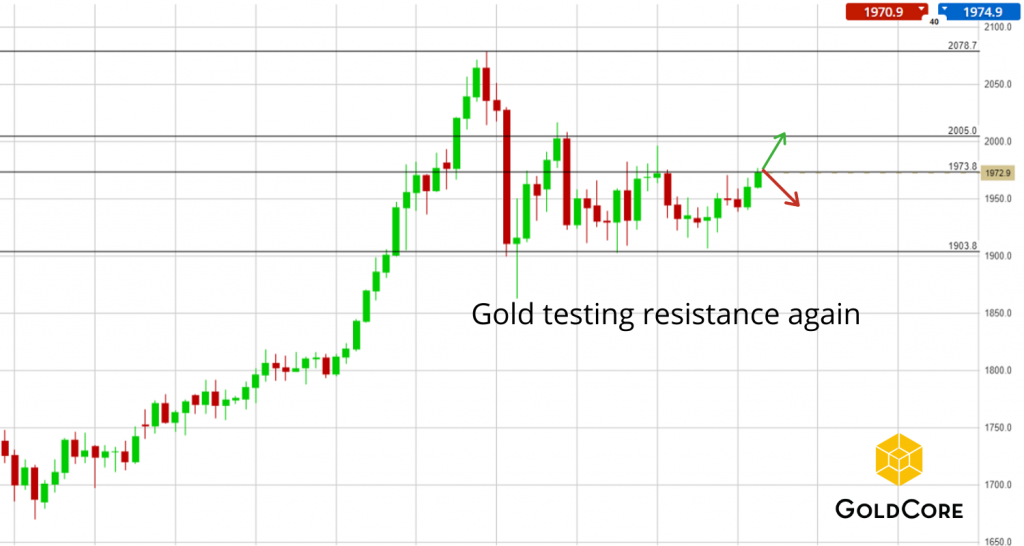 - Click to enlarge |
Full story here Are you the author?
Tags: Daily Market Update,Featured,newsletter


