


Jeffrey P. Snider
My articles My offerMy siteAbout meMy videosMy books
Follow on:LinkedINTwitterSeeking Alpha
|
There is simply no way to spin these figures as anything good. Not just the usual ones were talking about here, but more so some new data that you probably haven’t seen before. Beginning with the regular, it doesn’t matter that the level of initial jobless claims has declined substantially over the past few weeks. The fact of the matter is after 22 weeks of dislocation, at least eleven of them under reopening, these continue to rip along at around 1 million per week. One million. We’d never seen so much as 700k before (though the labor market is getting into the top range of 1981-82 adjusting for population as if that’s some good thing). Forget about the first half of the contraction (which the shutdown caused) and just focus on this second set of weeks since early May. There’s no way to describe them, more than double anything we’ve ever seen before. Not shutdown but the visible display of economic damage. |
U.S. Unemployment Insurance; Initial Jobless Claims, Mar 2017 - Jun 2020(see more posts on U.S. Initial Jobless Claims, )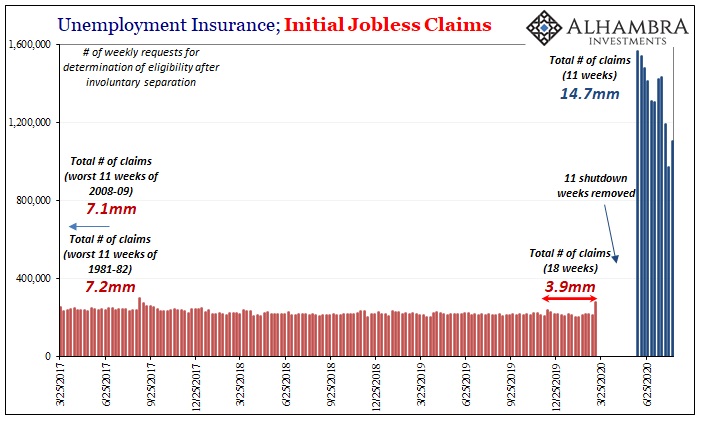 - Click to enlarge |
| The rebound isn’t being very bouncy, for one thing, no matter how many gigantic gobs of purported “stimulus” has been thrown at the economy. It ain’t stimulating. The number of jobs still being lost this late into it is unthinkable; historic.
I wrote a couple days ago about another key factor which appears to be what the productivity estimates have revealed; the terrifying possibility that though there’s been more job losses than at any time in history there may not yet have been enough of the longer-run variety to balance business perceptions of far lower post-GFC potential.
|
U.S. Unemployment Insurance; Initial Jobless Claims, Jan 1980 - 2020(see more posts on U.S. Initial Jobless Claims, ) - Click to enlarge |
|
In other words, the level of output and actual work performed had declined more than the reduction in headcounts, by a lot more, leaving us to suspect businesses were holding back a sort of reserve of their own workers (who were still on the books but idle nonetheless) having them at-the-ready for when reopening got started. Those are both (unemployment and productivity) relatively familiar numbers. Now along comes the IRS, of all places, to put even more disturbing emphasis on this idea. The government’s tax collector is preparing itself for severe, and permanent, shrinking in the labor market. Yesterday, the agency released its estimates for Publication 6961 (h/t Bloomberg). And the update to that release will make your blood run cold (while oddly explaining the NASDAQ). Before getting to the latest publication, let’s start by going back to happier days or what had seemed like reasonably less awful days during 2017. Globally synchronized growth was the mandate as well as widely accepted as some meaningful acceleration in the US and global growth. |
IRS Publication 6961, 2016 - 2028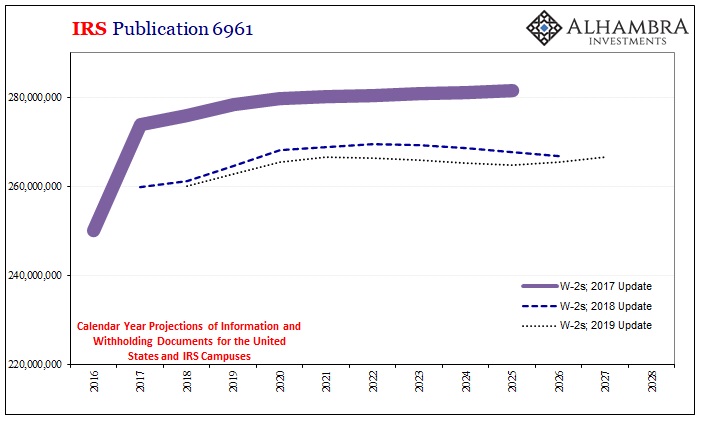 - Click to enlarge |
| Recovery at last.
Under 6961, the IRS estimates how many pieces of tax filings it will have to collect, sort, and manage. Perhaps the most important of all of them is the nation’s W-2’s, the way in which all workers report their incomes to verify withholding and calculate tax liabilities before the federal Leviathan. A job means a W-2, but many workers hold more than one job at a time, or during the year they may change jobs. So, it’s not an exact one-for-one, but when we’re dealing with big things it needn’t be perfectly precise. Even when we look at how 2017’s globally synchronized growth actually turned out in terms of managing all those paper and e-filed submissions: The first year listed in each update series is the actual number of W-2’s (not including W-2 G’s) that were collected. As you can see already, the labor market disappointed right from the start; the IRS had expected to process closer to 275mm W-2s during 2017 but ended up with less than 260mm. Reflation #3, as it turned out, as bonds had warned the whole time, not Recovery #1. Following that less robust labor market than expected, the IRS in 2018 and 2019 adjusted itself to lower levels – particularly after the big slowdown in employment that happened in 2018 when Euro$ #4 converted globally synchronized growth into the pre-COVID globally synchronized downturn. Which brings us to the 2020 update to Publication 6961 released yesterday…and holy sh$%. |
IRS Publication 6961, 2017 - 2020 Update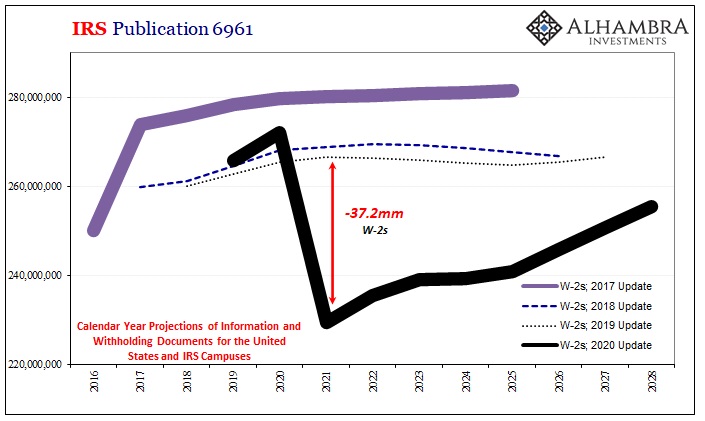 - Click to enlarge |
| Sorry, but an expletive is demanded in this situation:
The taxman thinks there may have been an uptick in W-2’s earlier this year associated with last year’s filing (I think they’ll found out that didn’t happen). But then, for next year, in 2021 as 2020’s W-2’s come rolling in, the agency anticipates receiving 37 million fewer of them than what it had been thinking this time last year. Thirty-seven million. Even more frightening, the IRS doesn’t believe the labor market is going to recover before 2028. And that is the biggest downside of all. Time is the greatest enemy. That doesn’t mean 37 million jobs have been eliminated. |
Payrolls Projections HH Pro Forma Deficit, Jan 2020 - Aug 2020 - Click to enlarge |
| Some of the gap is gig workers (a very small part) while much of it is probably going to be a whole lot less turnover; workers changing jobs and getting a W-2 for each during a year. If workers change fewer jobs because they’re uncertain or scared, as so often happens during the worst economic circumstances, then that would account for fewer total W-2’s being issued and turned in.
But at the baseline of these estimates, it has to be this or worse: |
Payrolls Projections LF HH, Jan 2014 - Aug 2020 - Click to enlarge |
The “V” is not a V; the rebound is not a recovery. The IRS could be wrong, of course, but when it has been, like so many other official predictions, in which direction is it typically wrong? Using mainstream models, as they’ve done here, when are the models ever overly pessimistic about longer run situations?
More importantly, these numbers are all consistent with each other; horrible 6961 combined with real unemployment filings and productivity estimates, each coming at the same piece, the labor market, of what looks to be the stark reality of our economic situation.
These right here are the huge jobs numbers, not what got posted by the BLS several Fridays ago. How can the most gigantic of payroll positives in history possibly be disappointing to the point of being irrelevant? Quite easily, it may turn out.
Full story here Are you the author?Tags: currencies,economy,employment,Featured,Federal Reserve/Monetary Policy,Initial Jobless Claims,jobless claims,Labor Market,Markets,newsletter,productivity,Taxes,Unemployment


