


| In June, for the third month in a row, money supply growth surged to an all-time high, following new all-time highs in both April and May that came in the wake of unprecedented quantitative easing, central bank asset purchases, and various stimulus packages.
The growth rate has never been higher, with the 1970s the only period that comes close. It was expected that money supply growth would surge in recent months. This usually happens in the wake of the early months of a recession or financial crisis. The magnitude of the growth rate, however, was unexpected. During June 2020, year-over-year (YOY) growth in the money supply was at 34.5 percent. That’s up from May’s rate of 29.5 percent, and up from June 2019’s rate of 2.04 percent. Historically, this is a very large surge in growth both month over month and year over year. It is also quite a reversal from the trend that only just ended in August of last year, when growth rates were nearly bottoming out around 2 percent. In August, the growth rate hit a 120-month low, falling to the lowest growth rates we’d seen since 2007. The money supply metric used here—the “true” or Rothbard-Salerno money supply measure (TMS)—is the metric developed by Murray Rothbard and Joseph Salerno, and is designed to provide a better measure of money supply fluctuations than M2. The Mises Institute now offers regular updates on this metric and its growth. This measure of the money supply differs from M2 in that it includes Treasury deposits at the Fed (and excludes short-time deposits, traveler’s checks, and retail money funds). The M2 growth rate also increased to historic highs in June, growing 22.9 percent compared to May’s growth rate of 21.9 percent. |
M2 and TMS/Rothbard-Salerno Measure, 1998-2019 - Click to enlarge |
| M2 grew 4.7 percent during June of last year. The M2 growth rate had fallen considerably from late 2016 to late 2018, but has been growing again in recent months. As of March, it is following the same trend as TMS.
Money supply growth can often be a helpful measure of economic activity. During periods of economic boom, money supply tends to grow quickly as banks make more loans. Recessions, on the other hand, tend to be preceded by periods of slowdown in rates of money supply growth. However, money supply growth tends to grow out of its low-growth trough well before the onset of recession. As recession nears, the TMS growth rate climbs and becomes larger than the M2 growth rate. This occurred in the early months of the 2002 and the 2009 crises. February 2020 was the first month since late 2008 that the TMS growth rate climbed higher than the M2 growth rate. The TMS growth rate again exceeded M2 in March and April 2020. As of mid-June 2020, it does appear that the decline in money supply growth has again preceded a recession. Although some observers will likely claim that the current economic crisis is a result solely of the COVID-19 panic and resulting government-forced shutdowns, several indicators do suggest that the economy was primed for a recession. The decline in TMS is one of these indicators, as is the late 2019 liquidity crisis in the repo markets. The Fed’s moves to drop interest rates and to once again grow its balance sheet speak to the weakness of the economy leading up to April 2020. After initial balance-sheet growth in late 2019, total Fed assets surged to over $7 trillion in June, setting a new all-time high and propelling the Fed balance sheet far beyond anything seen during the Great Recession’s stimulus packages. The Fed’s assets are now up more than 600 percent from the period immediately preceding the 2008 financial crisis. |
Assets: Total Assets, n.s.a. 2008-2020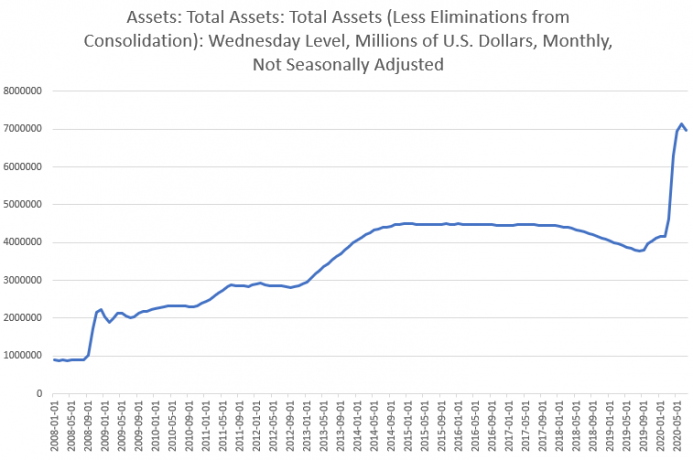 - Click to enlarge |
| While Fed asset purchases are not solely responsible for the surge in new money creation, they are certainly a sizable factor. Bank loan activity has surged as well, also driving new money creation.
Dollar volume for M2 and TMS: In terms of total dollar amounts now extant, the overall M2 total money supply in June was $18.1 trillion and the TMS total was $18.09 trillion. Since January, this is an increase of $2.7 trillion in M2, and $3.8 trillion in the TMS. |
Dollar volume for M2 and TMS, 1996-2020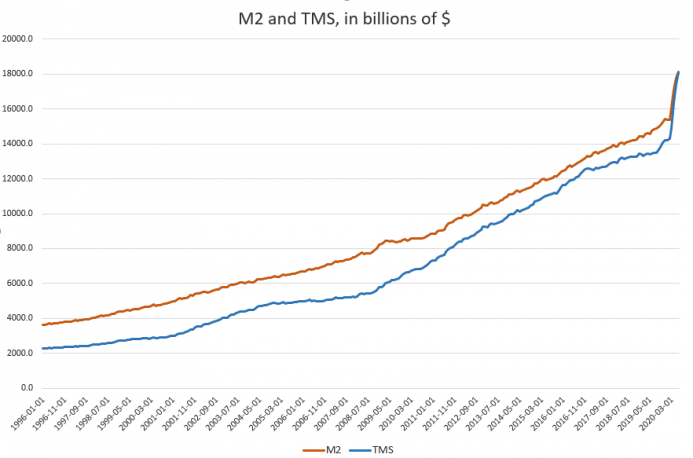 - Click to enlarge |
Full story here Are you the author?
Tags: Featured,newsletter


