


USD/CHF daily chartUSD/CHF is pulling back down slightly from the 2020 highs while reintegrating Friday’s range. The spot is trading below the 100/200-day simple moving averages suggesting an overall bearish bias. |
USD/CHF daily chart(see more posts on USD/CHF, )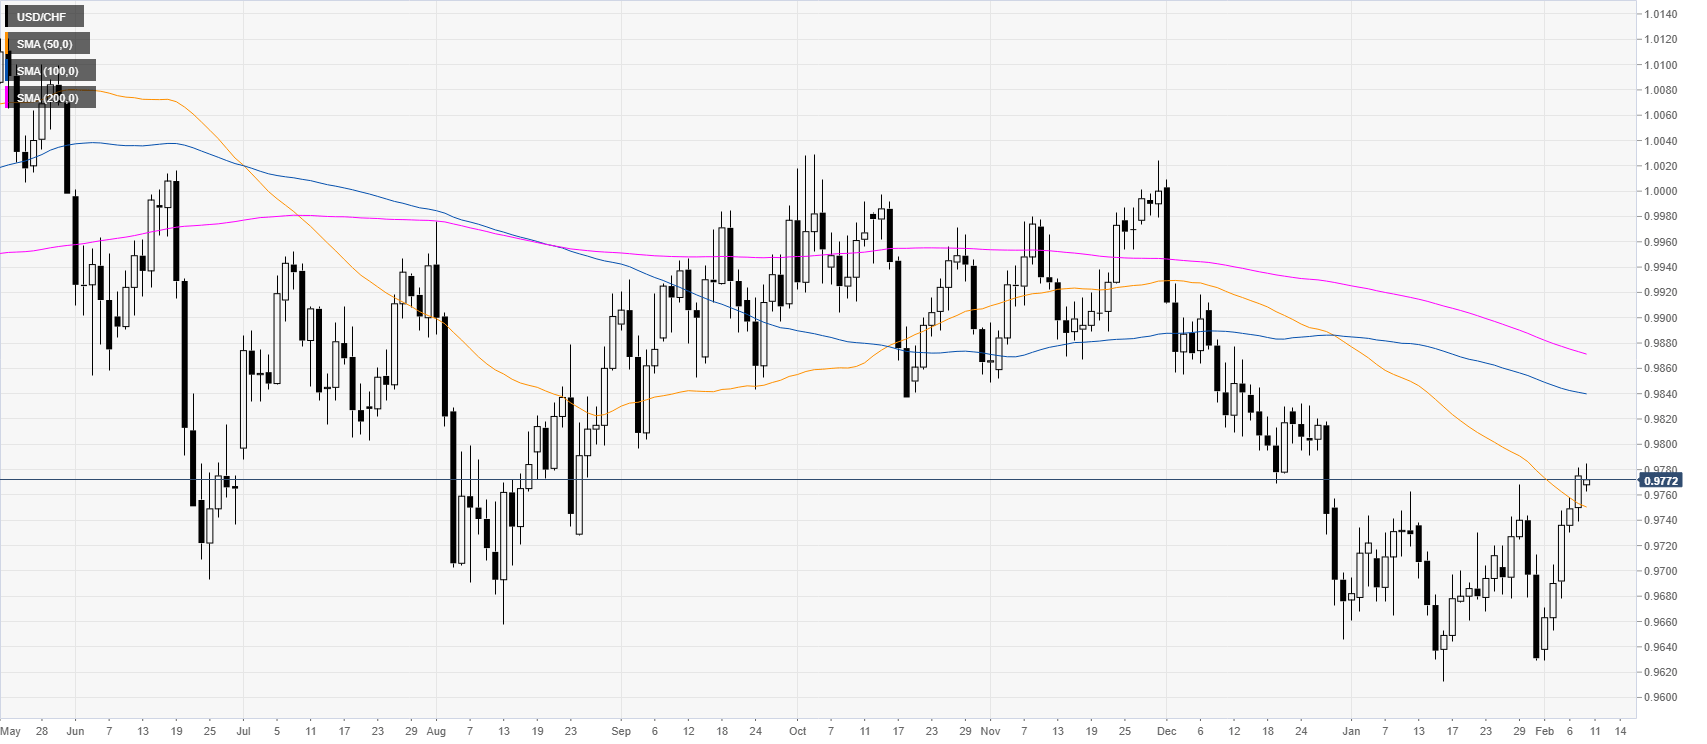 - Click to enlarge |
USD/CHF four-hour chartUSD/CHF is trading in a rising wedge pattern suggesting the market might be exhausting itself. If the bears break the 0.9770 support on a daily basis, the spot could decline towards the 0.9730 and 0.9710 price levels. On the flip side, if the buyers surpass the 0.9800 figure the quote could continue trending to the upside towards the 0.9830/50 levels. Resistance: 0.9800, 0.9830, 0.9850 Support: 0.9770, 0.9730, 0.9710 |
USD/CHF four-hour chart(see more posts on USD/CHF, )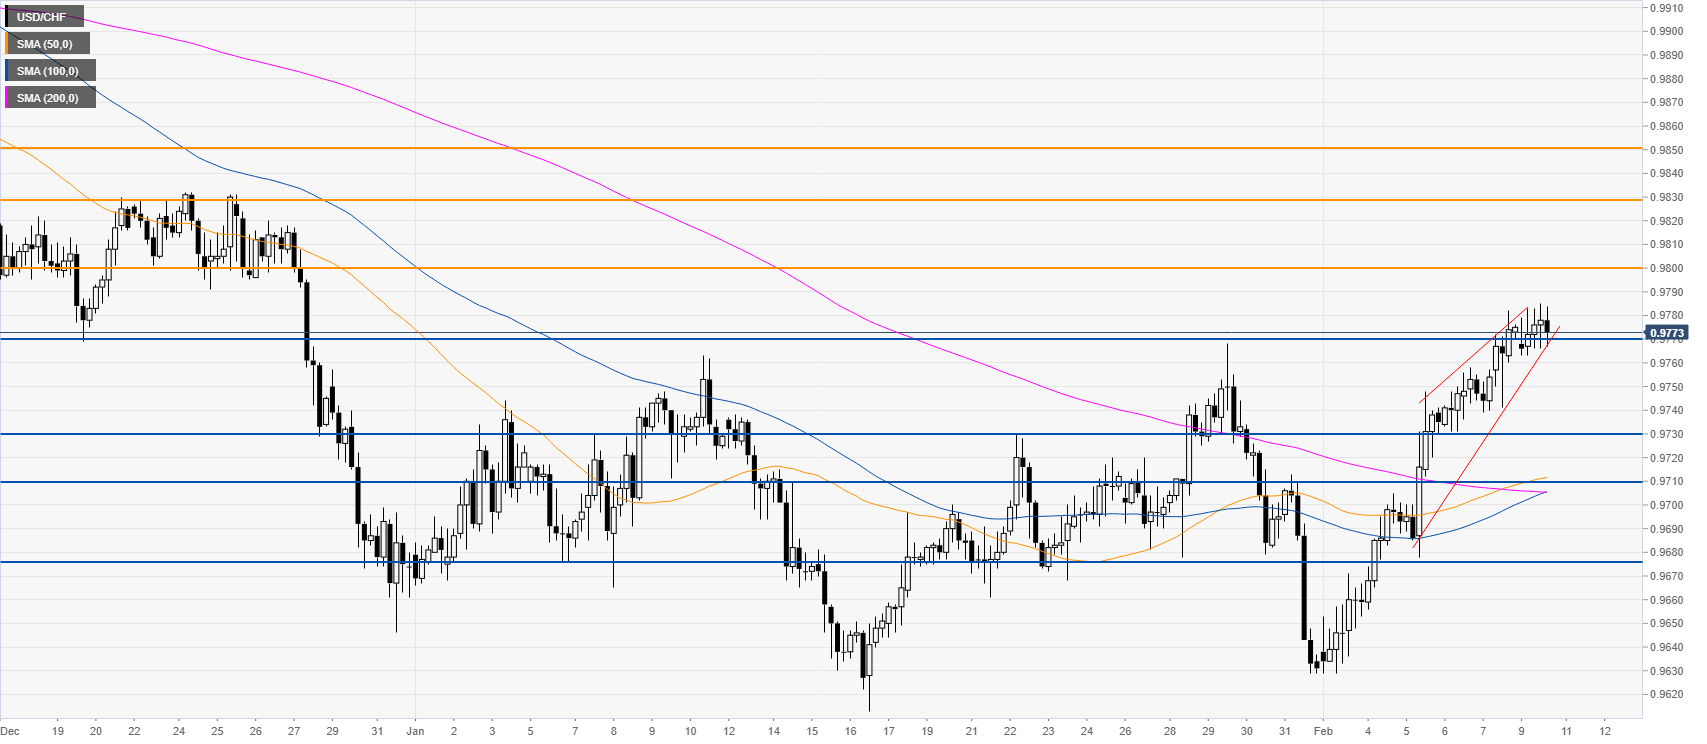 - Click to enlarge |
Full story here Are you the author?
Flavio has been engaged in the financial market since 2011 with experience in stocks, currencies, commodities and cryptocurrencies among others. In 2015 he completed a postgraduate diploma in Financial Trading Analysis from the University of Essex in collaboration with FXStreet.
Tags: newsletter,USD/CHF


