|
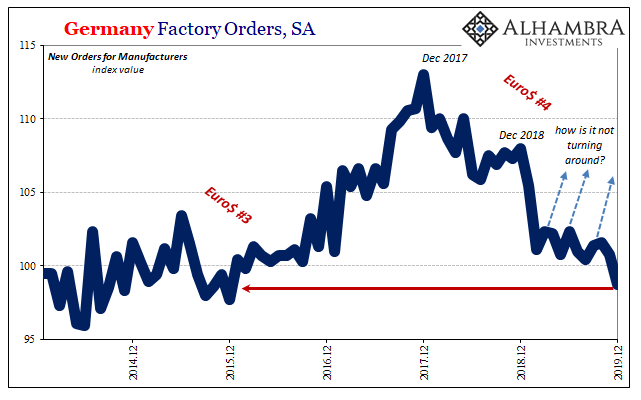
I wrote a few months ago that Germany’s factories have been the perfect example of the eurodollar squeeze. The disinflationary tendency that even central bankers can’t ignore once it shows up in the global economy as obvious headwinds. What made and still makes German industry noteworthy is the way it has unfolded and continues to unfold. The downtrend just won’t stop. According to Germany’s deStatis, factory orders in December 2019 were down sharply yet again. And it doesn’t matter how you look at them, seasonally adjusted or otherwise, in parts or at the whole, no bottom. In the adjusted series, orders set a new low to finish out last year. |
Germany Factory Orders, SA 2014-2019 |
| At a time when we were assured Europe’s QE would contribute greatly toward stabilizing conditions and that the global economy was turning around, “somehow” the message wasn’t received in this bellwether sector for this bellwether country.
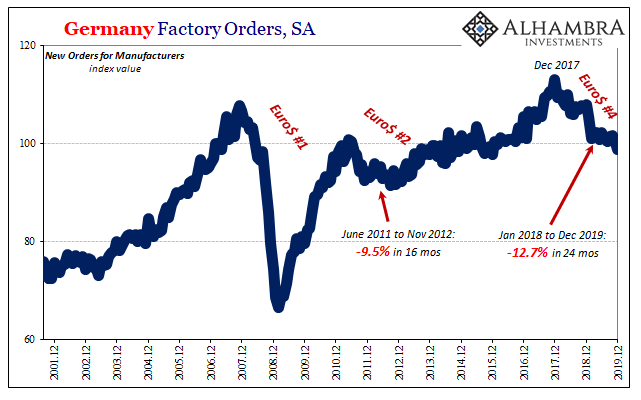
DeStatis believes orders for new manufactured goods were about the same in December as they had been in September 2015. It has erased everything from the “boom” of 2017 and then some. |
Germany Factory Orders, SA 2001-2019 |
Germany Factory Orders, SA 2009-2019 |
|
| It didn’t happen all at once, either. That’s ultimately the key takeaway; squeeze rather than shock.
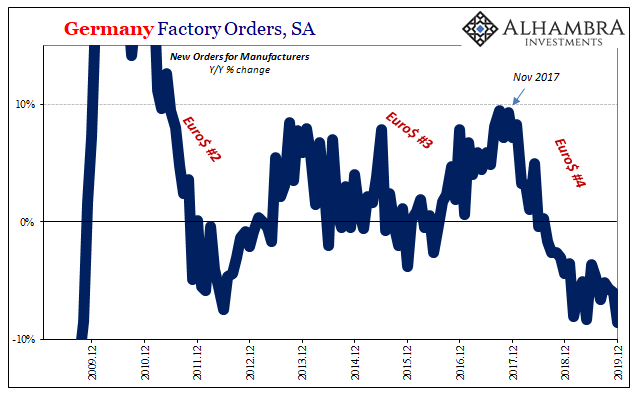
Sticking with the seasonally-adjusted figures, the year-over-year comparison was the worst since September 2009. At -8.6%, this one (Euro$ #4) continues to surpass Germany’s industrial experience during the 2012 recession (Euro$ #2) in every conceivable way and in each dimension. This downturn/contraction/recession has gone on for two whole years at least, no sign that it might be nearing an end, let alone reversing, at the dawn of 2020. The problem has been the drag from the foreign sector, places outside of Germany. Mostly that had meant China and Asia. Only some marginal weakness in demand from the rest of Europe, inspiring some hope that a “resilient” European economy would be able to stave off an even lower downturn bottom, perhaps becoming outright recession if unchecked. |
European Economy, 2004-2019 |
| In December 2019, it was orders from the rest of Europe which made the number so bad. While domestic factory orders were up 1.4%, European orders dropped by nearly 14%. Not exactly the most positive way to finish up 2019, particularly with Q4 GDP only the tiniest bit above zero already. Weakness is infecting outward, with the rest seemingly unable to stabilize and decouple from what has been hoped was always an isolated German problem.
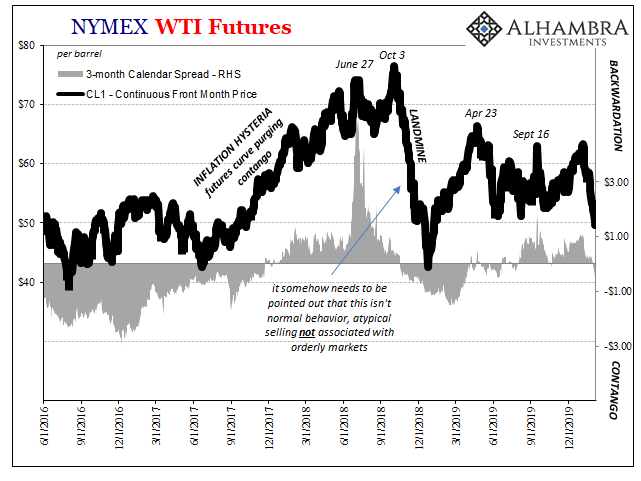
At the very least, it pushes the idea of an economic bottom and rebound a little further into the future which is once more a risky proposition. The longer the alleged turnaround fails to turn the economy around, the more impatient the world becomes waiting for what’s always promised. All this before the coronavirus. And that may be why there was such a dramatic (market) reaction to the outbreak pandemic. However it may turn out, the global economy isn’t actually in good enough shape to handle another potential headwind; contrary to popular assessment, those others are still blowing. Fear of getting pushed over the edge is quite real when you can’t ever seem to inch back away from it. It may be the oil market which has lost the most patience. It doesn’t matter to domestic oil traders that the two-year odyssey of Germany’s factory sector isn’t directly related to American conditions. Even central bankers have finally figured out that if there are “global disinflationary pressures” and they show up in one place as “headwinds” balance of probabilities means they’re going to show up everywhere. No one is immune from them; the question is only ever how badly they’ll sting. |
NYMEX WTI Futures, 2016-2019 |
| The WTI futures curve has flipped back into contango again, reaching more than $0.60 in recent trading (out to the third month on the curve). Even as oil prices rebounded today, the difference between the March 2020 contract (current front) and the June 2020 closed at -$0.63.
As we’ve seen every time oil prices fall, futures participants, particularly the money managers, are quick to jump ship. This is in contrast to 2018 when, despite net longs peaking all the way back in January 2018, by and large money managers (who largely set the oil price) held on to most of their record long positions as more and more things started to go wrong – the disinflationary dollar warnings that became the most visible headwinds upon Germany. |
Crude Oil, Light Sweet, 2006-2019 |
| Up until September 2018 they would demonstrated conviction in what was supposedly behind Jay Powell’s hawkishness.
September 2018, however, that was it. The landmine which followed shook the oil markets and it hasn’t really been the same since. Manager positions have been rebuilt toward net long peaks at various times in 2019, but these haven’t been sustained – as if crude futures investors aren’t convinced that all the “bottoms” we keep hearing about really are those. The net long for managers which had been 310k contracts the first week in January have been cut almost in half; 178k by the end of last month. There are very real and noticeable effects on the domestic oil market that have to be priced by every participant within it. |
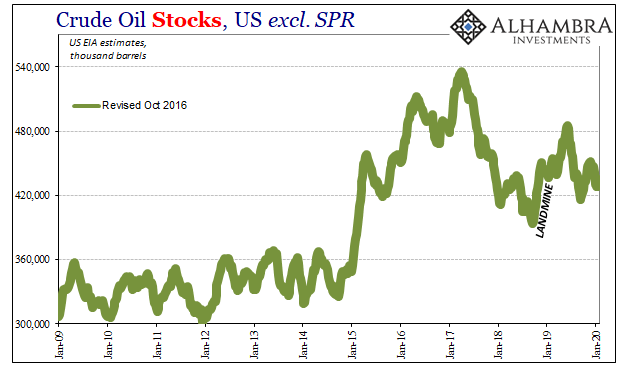
US Crude Oil Stocks, 2009-2020 |
| Oil stocks and inventory are a big one, as you can see just why September 2018 was the turning point. The economy was booming, they all said, and yet suddenly crude piled up all over the US for the second time in four years. |
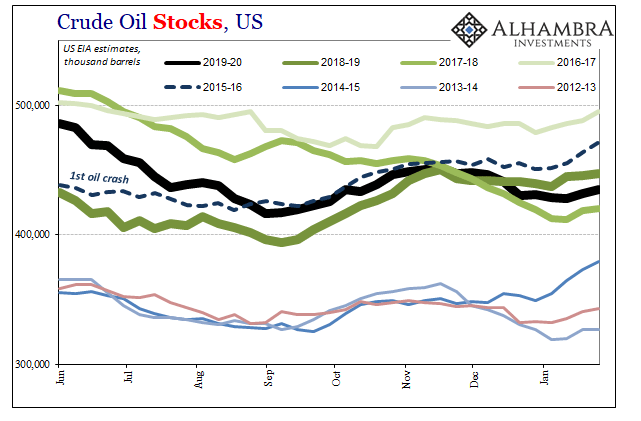
US Crude Oil Stocks, 2012-2019 |
| It started to again later in 2019 (black line above) but has improved marginally since mid-December. Then why the most recent oil crash? Not only worries about China and the economic effects of the pandemic, but more so because a lot of that inventory was merely converted into unsold distillates like gasoline.
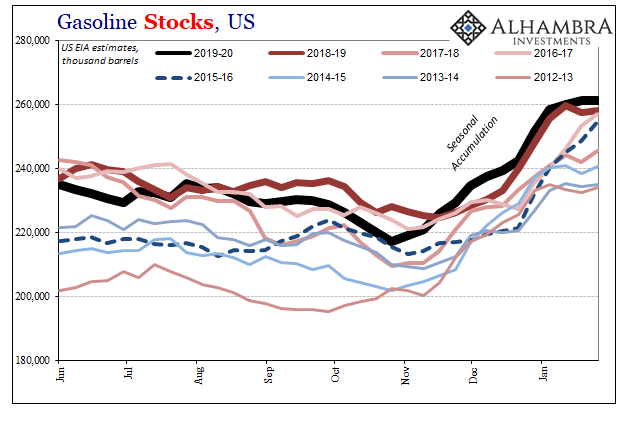
Among that latter, stocks are at record highs again recently; a very real shift in imbalance since the end of October (when the WTI curve had last showed some contango). There’s more gasoline sitting around this seasonal accumulation than during the one coincident to the landmine late 2018/early 2019. |
US Gasoline Stocks, 2012-2019 |
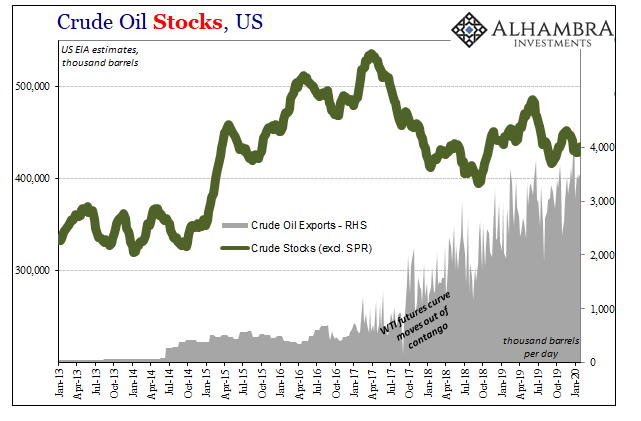
US Crude Oil Stocks, 2013-2020 |
|
| All this has happened in domestic conditions even though US producers and exporters continue to send more and more American crude overseas. The quantity being exported keeps rising at a pretty steady pace. That’s good for the world oil market as it means additional supplies for whatever geopolitical threat or socialist setback (Venezuela) in production.
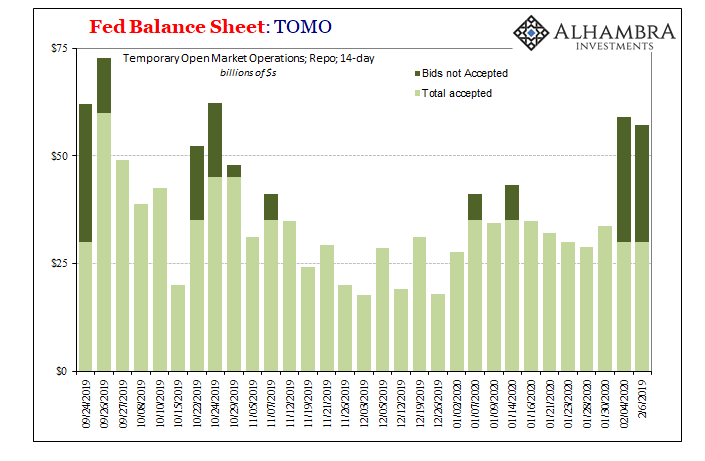
You have to wonder, though, what must be going on in terms of US demand that would continue to see high levels of stocks up and down the oil patch. The economy is puttering along at or just below its trend, Powell says, on the strength of a very strong labor market. Have you seen the unemployment rate? From German factories to Oklahoma tank farms – to repo demand at FRBNY, a second 2x oversubscribed term auction there today – there continues to be the unease, and evidence for, how Euro$ #4 may not yet be done. Headwinds that can be traced back to unabated global disinflationary pressures. |
Fed Balance Sheet: TOMO 2019 |
Full story here Are you the author? Previous post See more for Next post
Tags: commodities,contango,Crude Oil,currencies,economy,Euro$ #4,Europe,Federal Reserve/Monetary Policy,Germany,Markets,newsletter,OIL,repo,WTI,wti futures


