


Jeffrey P. Snider
My articles My offerMy siteAbout meMy videosMy books
Follow on:LinkedINTwitterSeeking Alpha
|
Just in time for more discussions about repo, the Federal Reserve delivers. Not in terms of the repo market, mind you, despite what you hear bandied about in the financial media the Fed doesn’t actually go there. Its repo operations are more RINO’s – repo in name only. No, what the US central bank actually contributes is more helpful data. Since our goal is to use that data to produce the best possible, most accurate interpretation of the facts, the depth and details contained within the exhaustive Z1 series, the Financial Accounts of the United States, are, like TIC, invaluable. To get to repo, though, we’ve got to start in credit. The Z1 table for Depository Institutions (L110) breaks down the US banking system’s collective balance sheet. From it, we can get a sense of what’s going on as it relates to the financial ends of the economy – starting with its aggregate size. |
US Depository Institutions, 2008-2019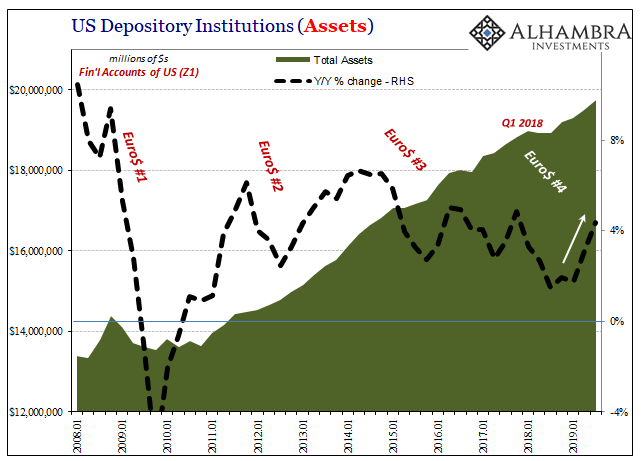 - Click to enlarge |
| Total assets of all depositories has rebounded in 2019, as you can see above. From a post-crisis low reached in Q3 2018, a near halt in all balance sheet expansion, asset growth has accelerated back to near where it had been at the top of Reflation #3 (the modest risk-taking behind what was called globally synchronized growth, if you prefer).
But this acceleration in the overall balance is misleading. To see why, we need to break down the composition of assets. Easy enough, we simply separate them into two buckets: in the first we include only US Treasuries and US agency debt instruments; in the other, everything else. This gives us a partial proxy for determining behavior. |
US Depository Institutions, 1953-2018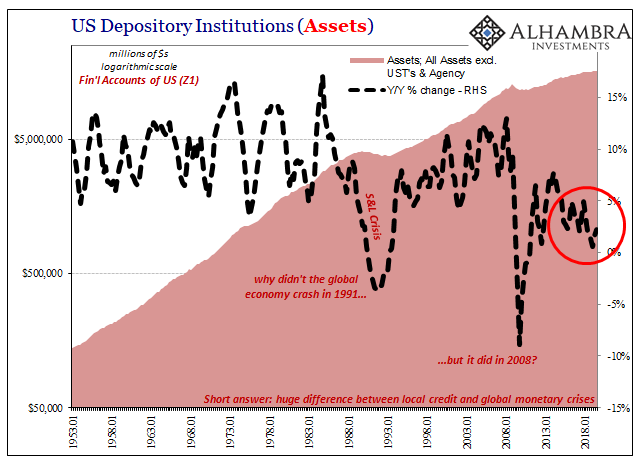 - Click to enlarge |
| In the first bucket are the safest and most liquid securities, UST’s and comparable agencies that also happen to be great for repo collateral. The remainder is everything else, loans and other kinds of assets we would expect the banking system to expand on when they feel much better about the risk/return characteristics of the parts of the world within which they operate. |
US Depository Institutions, 2007-2019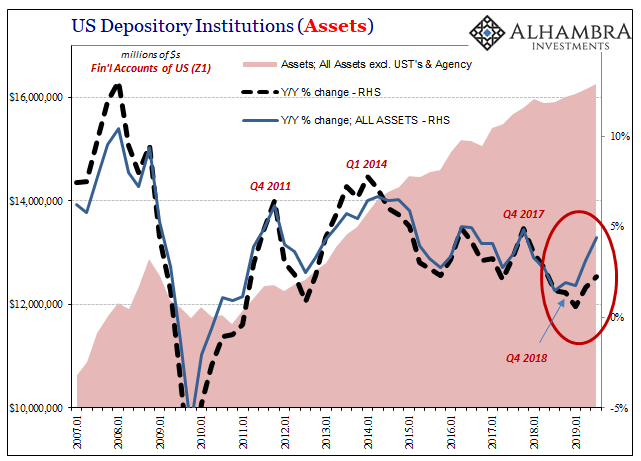 - Click to enlarge |
| Sure enough, what we find is that the risky bucket, the latter one (the dotted black line), hasn’t been growing much at all since the end of 2017. Growth of the assets contained within it accelerated only a little bit in 2019, far less when compared to the overall total.
In other words, what’s really driving asset growth for the entire banking system in the US in 2019 are holdings of those risk-free assets, especially those of US Treasuries. During the third quarter of 2019, US banks added almost as much as they did during that tumultuous fourth quarter of 2018 (landmine), which remains the biggest increase on record. And Q3 nearly equaled it. There are some who will still claim that banks are being forced into this, meaning the dealer banks included at the top of this list of all depositories. But, as you can see above, the ebbs and flows in bank holdings of UST’s doesn’t correlate at all with the ebbs and flows of the federal government’s fiscal deficits. They do correlate very, very closely with the facts – they are indeed very stubborn things – in this case meaning market prices and therefore liquidity indications spread all throughout the various corners of the bond markets. |
US Depository Institutions, 2008-2019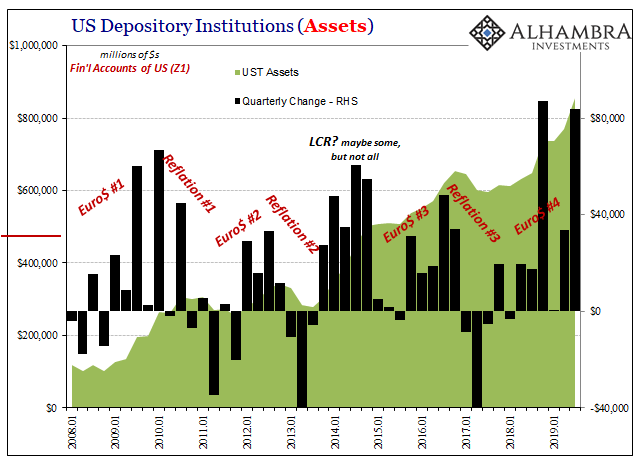 - Click to enlarge |
| To put it simply, when banks perceive a general increase in liquidity risks they have added, and will continue to add, Treasuries (and agencies).
Willingly, as one prominent voice has now conceded. That’s not all. In addition to what this data allows for us to reconcile with the facts as they relate to potential demand for collateral in repo, we also find quite a bit on the demand for repo funding. As I detailed some months ago, the repo market really is the lender-of-last-resort; not the Fed. And that is especially true for financial institutions connected to as well as residing outside of the United States. In terms of the Z1 data that means the ROW segment, or rest of world. What is it that the domestic presence of the foreign sector is demanding of the markets in terms of its liabilities, the basis to fund US$ positions held pretty much anywhere?
And we see it here yet again. Repo liabilities reported by ROW had jumped to Q1 2019, the update for which the above was written about six months ago. Over the two intervening quarters ROW repo liabilities have positively exploded. |
Rest of World, 2009-2019 - Click to enlarge |
Since Q3 2018, the one just prior to the landmine, the Federal Reserve’s Z1 estimates show an astounding 42% increase in repo funding for the ROW sector – that’s a surge in demand of $359.3 billion – at the same time other forms of dollar liabilities are shrinking.
In short, as the foreign sector finds it more and more difficult to fund in US$’s in other formats, it more and more turns to the repo market as the last resort. No wonder repo rates get pressured.
And, obviously, it has nothing whatsoever to do with the US government’s deficit or QT, nor does it go along with so many other excuses for repo that have been uncorked over the last year or year and a half. Going back to the end of 2017, all of this stuff uniformly does, the offshore dollar system must’ve gone back into retrenching which herded, and still herds, more and more into repo.
Maybe you start to wonder as I have for a very long time if anyone at the Fed actually reads and takes seriously any of their own data. I sincerely doubt it simply because it constantly leads in the direction no central bank policymaker or staffer can ever go.
Everything points to offshore dollars, even the domestic holdings of US Treasuries, but in the official world such a thing doesn’t exist. And that’s why they continue to have so much trouble with the repo, let alone the facts.
Full story here Are you the author?
Tags: bank reserves,Bonds,collateral,currencies,economy,EuroDollar,Federal Reserve/Monetary Policy,federal-reserve,financial accounts of the united states,global dollar shortage,Markets,newsletter,repo,U.S. Treasuries,z1


