


- Global equity markets continue to power higher US-China trade tensions have eased
- MSCI World made a new all-time high today near 2290 and is up 23% YTD
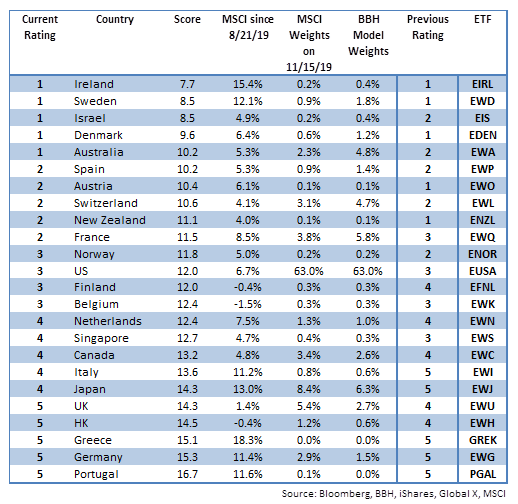
- Our 1-rated grouping (outperformers) for Q4 2019 consists of Ireland, Sweden, Israel, Denmark, and Australia
- Our 5-rated grouping (underperformers) for Q4 2019 consists of the UK, Hong Kong, Greece, Germany, and Portugal
- Since our last update on August 21, our proprietary DM equity portfolio has risen 6.7%, slightly underperforming MSCI World (up 7.1%)
DM EQUITY OUTLOOK
Global equity markets continue to power higher US-China trade tensions have eased. Despite some recent signs of concern, we expect a Phase One deal to be signed before year-end. We think tariff rollbacks will be part of the deal, though the speed and extent has yet to be determined. This is undoubtedly good for global growth. The major central banks remain in dovish mode, which adds a positive liquidity element to the story.
MSCI World made a new all-time high today near 2290 and is up 23% YTD. This compares to 11% YTD for MSCI EM and represents the rare occasion where DM stocks outperform their EM counterparts. It’s worth noting that the correlation between EM and DM stocks is currently 0.57. Whilst below the September peak near .68, it is still above the low around 0.49 seen earlier this month. Within DM, the best performers YTD have been Ireland, France, and the Netherlands, while the worst have been Hong Kong, Finland, and Norway.
We believe it is very important for investors to continue focusing on country fundamentals. Hedging out currency risk will become more important for US investors if the strong dollar trend resumes. Furthermore, we continue to look for potential divergences within DM. Regionally, North America is the best equity performer so far in 2019 (25.7% YTD), followed by Europe (22.2% YTD) and the Pacific (15.2%). We think that if the trade war eases as we expect, Asia will outperform more.
Our 1-rated grouping (outperformers) for Q4 2019 consists of Ireland, Sweden, Israel, Denmark, and Australia. Israel and Australia both improved from 2 to 1, pushing Austria and New Zealand down from 1 to 2. France improved from 3 to 2, pushing Norway down from 2 to 3. We note that of the top 10 countries, 7 are in Europe, 2 are in Asia, and 1 is in the Middle East.
Our 5-rated grouping (underperformers) for Q4 2019 consists of the UK, Hong Kong, Greece, Germany, and Portugal. Italy and Japan both improved from 5 to 4, pushing the UK and Hong Kong down from 4 to 5. We note that of the bottom 10 countries, 6 are in Europe, 3 are in Asia, and 1 is in North America. There was other notable movement as Finland improved from 4 to 3, pushing Singapore down from 3 to 4.
MODEL PERFORMANCESince our last update on August 21, our proprietary DM equity portfolio has risen 6.7%, slightly underperforming MSCI World (up 7.1%). Overweighting Australia and Switzerland hurt our return, as these markets underperformed with relatively large weights. Underweighting Japan and Germany also hurt our return as these markets outperformed with relatively large weights. What calls helped our model return? Overweighting Ireland and Sweden helped our return as these markets outperformed, albeit with relatively small weights. Elsewhere, underweighting the UK and Hong Kong helped our return as these markets underperformed with relatively large weights. |
 . |
MODEL DESCRIPTION
Our equity allocation model is meant to assist global equity investors in assessing relative sovereign risk and optimal asset allocation across countries in the DM universe. The countries covered include all 23 of the countries in the MSCI World Index. We have also included Greece in this model. Even though MSCI puts the nation in MSCI EM, we continue to view it as DM.
A country’s score reflects its relative attractiveness for equity investors – the likelihood that its equity market will outperform the rest of our DM universe over the next three months. A country’s score is determined as a weighted composite of 15 economic and political indicators that are each ranked against the other 23 countries in our model DM universe. Categories are industrial production growth, real interest rates, export growth, expected P/E ratio, real bank lending, yield curve steepness, real money growth, GDP growth, investment/GDP, per capita GDP, inflation, retail sales, political risk (EIU), leading indicators, and ease of doing business (World Bank). A country that is typically ranked first in many of the categories will end up with a low composite score (the lower the better).
From a portfolio construction standpoint, we are benchmarking to MSCI World. As a result, our BBH model portfolio weights will be Underweight/Overweight compared to the MSCI weights.
- Countries that are rated 1 will have a BBH weight that is 2.0 X MSCI World weight.
- Countries that are rated 2 will have a BBH weight that is 1.5 X MSCI World weight.
- Countries that are rated 3 will have a BBH weight that is equal to MSCI World weight.
- Countries that are rated 4 will have a BBH weight that is 0.75 X MSCI World weight.
- Countries that are rated 5 will have a BBH weight that is 0.5 X MSCI World weight.
To have the BBH model portfolio weights add up to 100%, there may be some exceptions to the rules outlined above. However, we will always try to keep to these parameters as closely as possible.
CHANGE IN METHODOLOGY AND COVERAGE
In the past, we have taken a simple average of each grouping (1 through 5) to determine model performance. That allowed small markets to skew the results. We are now taking a weighted approach, with country returns weighted by the BBH model weightings. Then, we compare our model performance against the benchmark MSCI World.
Full story here Are you the author?Tags: Articles,developed markets,newsletter


