


Pater Tenebrarum
My articles My siteAbout meMy videosMy books
Follow on:TwitterSeeking AlphaFacebook
Chaos in Overnight Funding MarketsMost of our readers are probably aware that there were recently quite large spikes in repo rates. The events were inter alia chronicled at Zerohedge here and here. The issue is fairly complex, as there are many different drivers at play, but we will try to provide a brief explanation. There have been two spikes in the overnight general collateral rate – one at the end of 2018, which was a first warning shot, and the one of last week, which was the biggest such spike on record, exceeding even that seen in the 2008 crisis. The funding stresses in overnight repo markets were the culmination of a problem that has been simmering in the background for quite some time. It was partly the result of new banking regulations implemented after the GFC (Basel III), the change in money market regulations, the decrease in excess reserves due to QT (as well as for other reasons), a government that is spending like a drunken sailor, and last but not least, assorted yield curve inversions. In essence, the problem is that there is a surplus of treasury collateral looking for short-term funding, and not enough liquidity. But how did this situation come about? |
US Overnight repo rate, 2014-2019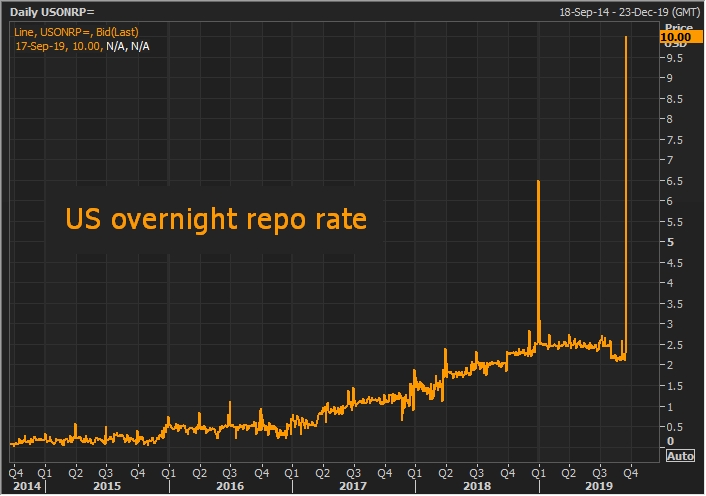 - Click to enlarge |
Relieving a Collateral ShortageReaders may recall that we have previously discussed the Treasury’s general account at the Fed. When money market fund regulations changed in 2016, one of the problems was that demand for treasury bills was set to soar, as MM funds repatriated money previously invested in commercial paper (mainly issued by European banks) in the euro-dollar market for the yield pick-up. In other words, the problem at the time was the opposite of that prevailing currently – there was not enough treasury collateral, particularly of the short term variety. The Treasury inter alia over-issued t-bills as a counter-measure. In fact, the situation played into the hands of the Treasury, which wanted to shore up its cash position anyway so as to increase its flexibility during the recurring debt ceiling circus in Washington (when whichever party is not running the administration pretends to care about government debt). It evidently did so again in early 2018, in response to corporate repatriation flows after the tax reform (US companies repatriated euro-dollars which they had previously lent to non-financial corporations in Europe and as a result, demand for t-bills increased once again). US Treasury, general account at the Fed. There were large increases in the Treasury’s cash hoard in 2016 and 2018, which were aligned with the change in MM fund regulations and the repatriation of corporate funds after the tax reform. This was probably not a coincidence. However, this was not the only thing that happened. In 2015, one year before MM fund regulations changed, banks needed to downsize their balance sheets to comply with the Basel III supplementary leverage ratio (SLR). The Fed supported their effort to shed deposits (and concomitantly, excess reserves) by uncapping the previously capped reverse repo facility for foreign official institutions. This also created an incentive for foreign CBs to get out of treasury debt and deposit cash in the RRP facility instead. |
US Treasury, general account at the Fed, 2016-2018 - Click to enlarge |
| The Fed’s reverse repurchase facility for foreign official institutions. This is mainly used by foreign central banks wanting to park cash rather than holding treasury debt. The surge in 2015 was reportedly mainly due to Japan (the identities of RRP facility users are not disclosed, but it can be inferred who is doing what by analyzing offsetting entries in the balance sheets of foreign central banks). The 2019 surge had different reasons, which we will discuss further below.
The incentive consists of the interest paid on balances held in the RRP facility. While this rate is not officially published, it is assumed to consist of a mixture between the overnight general collateral rate and SOFR (the LIBOR replacement in waiting). In short, in 2015 the Fed was trying to kill two birds with one stone: help commercial banks to get rid of the deposits of foreign CBs and at the same time increase the amount of treasury collateral in the market (particularly t-bills, which at the time still sported negligible yields) in order to smooth the transition to its planned rate hike cycle. Readers may recall that the Fed originally planned to implement its first rate hike in early to mid 2015, a plan it later abandoned. If 3-month t-bill discount rates had refused to budge due to a collateral shortage, it would have complicated the attempt to raise rates. Foreign CBs bought some $400 billion in short term treasury debt during the 2008 GFC alone, and by 2015 they still held around $350 billion in t-bills. Freeing up some of these holdings was evidently considered a good idea at the time. Since then, a number of other developments have occurred and ultimately brought about the situation that has recently upset the repo markets. |
Reverse Repurchase Agreements with Foreign Official Institutions, 2015-2019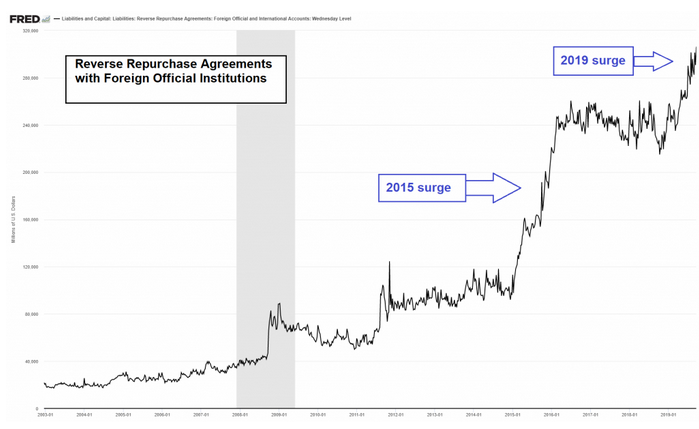 - Click to enlarge |
Basel III Regulations Heighten Demand for ReservesIf the Fed keeps the asset side of its balance sheet unchanged – which it did after ending “QE3” – and certain items on the liability side increase (in this case: RRPs with foreign Cbs, the Treasury’s general account deposits and of course also currency in circulation, which continues to grow year after year), other liabilities have to decrease commensurately – namely, excess reserves held by commercial banks with the Fed. Excess reserves of commercial banks – the red vertical line indicates the beginning of 2015. In late 2014, the QE3 program ended, in early 2015 the Fed uncapped the RRP facility for foreign official institutions. Still later it started to decrease its reinvestment of the proceeds from maturing securities bought under the QE programs, which led to a further decrease in excess reserves. The Fed finally started to raise rates in December 2015 and shortly thereafter began to gradually allow securities bought under its QE programs to run off its balance sheet (“QT”) by decreasing the monthly reinvestment of proceeds from maturing treasuries and MBS. During this time, further Basel III regulations came into effect, such as the LCR (liquidity coverage ratio – which forces banks to pre-fund their 30-day liquidity needs with reserves and high quality assets and is based on end-of-day balance sheet snapshots) and lastly, the RLAP (resolution liquidity and positioning) regulation, which de facto supersedes the LCR. The RLAP regulation requires banks to pre-fund their intraday liquidity needs. Previously intraday flows of liquidity left a “hole” of a few hours, during which large banks would be a bit light liquidity-wise. The new rule is meant to forestall this type of situation. In theory, if a bank that has large outflows in the morning that return in the afternoon goes bankrupt at noon, it will no longer be in compliance with the LCR in the evening. Having to comply with the new regulation obviously increased the demand for bank reserves further, just as excess reserves continued to fall as a result of “QT”. |
Excess reserves held by commercial bank with the Fed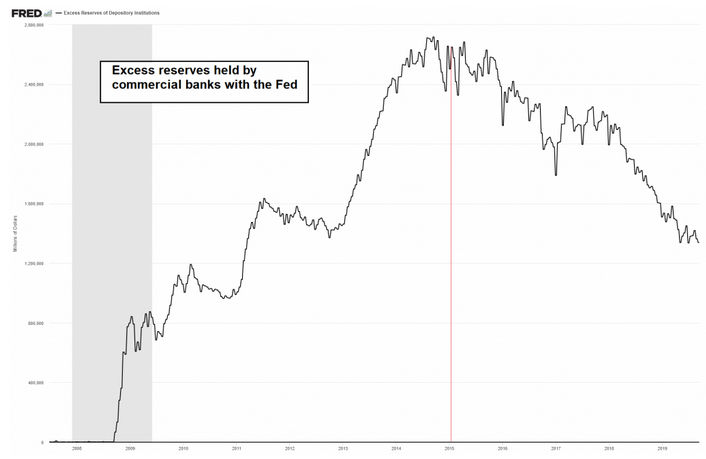 - Click to enlarge |
Disappearing Carry TradeIn light of the fact that excess reserves were still historically high, it was held that there was a sufficiently large buffer to handle any sudden additional demand for liquidity. However, as it is wont to do, the Fed’s tightening cycle eventually led to an inversion of the yield curve, and that created a new set of problems. First (in October 2018) the treasury curve inverted from the perspective of foreign buyers who need to hedge their FX risk. This is to say, the cost of hedging dollar risk for three months began to exceed the yield on the 10-year note. In late November 2018, 3-month LIBOR inverted against the 10-year note yield. Then, in April 2019, 3-month t-bill discount rates inverted against the 10-year note yield. In late November 2018, 10-year treasury yields fell below 3-month LIBOR The effect of this series of yield inversions was that a lot of demand for US treasuries from participants in the carry trade disappeared. Foreign buyers hedging their FX risk fell by the wayside, then buyers that fund their purchases at LIBOR rates (i.e., foreign banks), and finally domestic demand was impacted as well when the “classic” yield curve inversion struck. Obviously, there is no point in buying treasuries in carry trades when they cost rather than make money (the FX hedging cost inversion perversely has also resulted in negative-yielding foreign government bonds actually providing a larger net positive yield to US-based buyers than US treasuries bought outright). It is estimated that QT and the carry trade together accounted for about $800 billion in treasury demand that had to be replaced. One of the consequences of all this demand disappearing was that primary dealer inventories started to soar – they went from $75 billion in late 2018 to almost $300 billion recently. And so the collateral shortage of 2015-2016 became a giant collateral surplus. Primary dealers are legally organized as non-banks, even though they are banking subsidiaries (this is the main reason why “QE” not only boosted bank reserves, but also deposit money and why QE led to a sharp increase in the money supply). More importantly, they have to provide a bid for treasuries if no-one else does. It is one of the contractual obligations one has to agree to in order get licensed for this business. Since both primary dealers and banks have large liquidity requirements, the previous buffer of excess reserves was no longer sufficient when an unexpected drain on liquidity finally did strike. Since the removal of the most recent “debt ceiling” this summer, the US treasury has been on a mighty borrowing spree. Between $700 to $800 billion in new treasury issuance is expected in the course of the second half. A combination of heavy treasury issuance coinciding with a liquidity drain caused by corporate tax payments was apparently all it took for the collateral-liquidity mismatch to get out of hand and produce the spikes in o/n repo rates depicted in the first chart above. So much for the mechanics of the situation (mind, this is just a rough overview – we have not discussed every detail for the sake of brevity). |
3-month LIBOR, 10-year US treasury note yield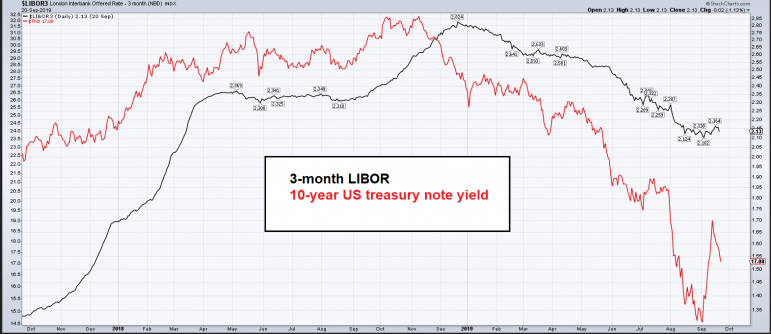 - Click to enlarge |
The Fed’s economic forecasting department
The Fed – Groping in the Dark Again
Contrary to similar spikes in repo rates in 2008, it was probably not fear of counterparty risk that led to the recent repo quake. What’s more, the Federal Reserve without a doubt knew that something like this was coming. We say this because even we knew it – it was not a secret. A number of analysts have warned of just such a situation for months.
It is true that the repo market indigestion is in a sense a “technical problem”, since the lender of last resort can create money and bank reserves in unlimited amounts at will – which it has indeed started to do in response. The Fed is now offering large repo operations to banks and dealers in order to bring rates back to desired levels (note that inter alia the federal funds rate also moved briefly above the upper end of its target corridor during the repo quake).
And yet, it is astonishing that the Fed somehow seemed unprepared and quite surprised by the extent of the liquidity shortage. We would submit that this fact alone is a good reason for markets to be concerned. If the Fed is not even able to properly gauge such a “technical problem” in advance, what else is there it does not know?
That is a trick question – the answer is of course “plenty”. One thing it definitely does not know is what the “correct” market interest rate should be. Economists would be aghast if the government were to introduce price controls for other goods in the economy, but somehow they seem to think that bureaucrats should control the price of credit and the supply of money. It simply makes no sense, until you realize they have been bought off.
In an unhampered free market economy, rates would rise to the extent needed to draw sufficient liquidity to the market. Furthermore, the US Treasury would probably be forced to curtail its spending and borrowing. These things are not “allowed” to happen with a central economic planning agency administering interest rates and the money supply.
Conclusion – Lagged Effects of Tightening Are Beginning to Play Out
One thing the repo quake did reveal is that liquidity is much tighter than was previously assumed. We believe this means that the Fed is shortly going to resume “QE” in some shape or form (whether it will be called “QE” or something else is irrelevant – it will definitely grow its balance sheet again). According to some estimates $400 to $520 billion in net purchases are expected to be seen before the end of the year (this is to say, in addition to reinvestment of the proceeds from maturing MBS).
Furthermore, this probably also means that despite its protestations to the contrary, the Fed will continue to cut rates, as removing the yield curve inversion will restore carry trade demand for US treasuries. Recent economic data show that the US manufacturing sector – which accounts for more than 40% of the economy’s gross output – is in recession by now. This should provide the Fed with the fig leaf needed to justify additional rate cuts and securities purchases.
Superficially one may think that this is a positive development for “risk assets”, but it actually isn’t – at least not yet. We are merely at the beginning of the phase when the lagged effects of the massive slowdown in money supply growth are playing out. The fact that the Fed is “forced” to react to liquidity shortages and a rapidly cooling economy is actually a bad sign for stocks and corporate bonds. Keep in mind that whatever pumping measures it puts into place, their effect will also be subject to a sizable lag.
We plan to post an update on the money supply situation and recent ominous developments in the credit markets shortly.
Charts by Reuters, St. Louis Fed, stockcharts
Full story here Are you the author?Tags: central-banks,Credit Markets,newsletter,On Politics

