I’ve said all along that they would be dragged into them kicking and screaming. After all, the Federal Reserve undertook its last rate hike in December 2018 – just as the markets were making clear he was completely mistaken in his view of the economy. What followed was the ridiculous “Fed pause” which pretty much everyone outside of the central bank and the Economics profession knew wasn’t the end of it.
You know the story. When he finally gave in at the end of July, the Federal Reserve Chairman at first hinted it was a one-and-done insurance type of thing. Powell said it was nothing more than a mid-cycle adjustment, “not the beginning of a long series of rate cuts.”
Then another followed in September, and despite what is now a series (if not yet a long one) Jay Powell is sticking with his mid-cycle adjustment.
Asked about it at his September 17 press conference, the day after the repo rumble, the Chairman continued to say the same thing as he said last year with rate hikes, earlier this year while pausing, and now already a short series of rate cuts:
It’s practically rote recitation at this point. Powell is more robot than thinker. The economy, he will keep saying no matter what happens, is favorable particularly because of the strong labor market. Forever strong. But he can only be linking the term to the unemployment rate; the rest of the labor data instead indicates very clearly how something big has changed this year. The headline payroll figures are down, on average, to where they were when Ben Bernanke’s Fed unable to launch his own second series of rate cuts (because he was still stuck at the zero lower bound) opted instead for more of the theater of QE. The internal employment data (hours) also points to a meaningful change in condition. |
Average Weekly Hours All Employees, 2007-2019 |
| Separately, the BLS today leaves little doubt as to this inflection. If the labor market was strong last year, and that was debatable, it simply cannot be this year. It is something else entirely, even if that doesn’t mean there is a recession (yet) lurking in the figures.
That’s really the major point here. Weakness compounds downside risks. The weaker the labor market becomes in reality outside of Powell’s terminology, the greater the risks to the overall economy. It takes a much smaller and otherwise less substantial trigger for something worse to take shape. |
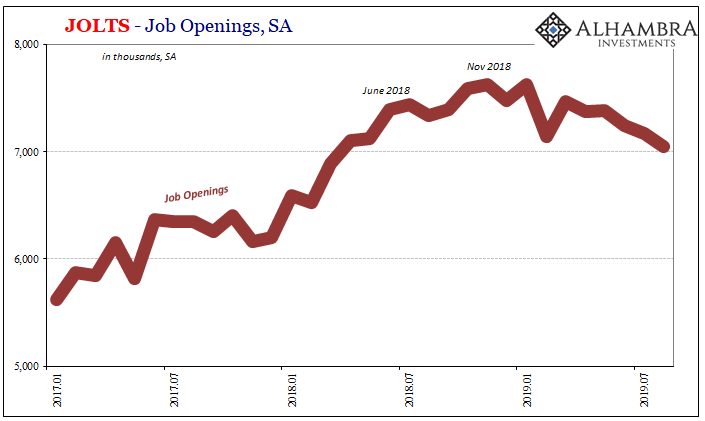
JOLTS - Job Openings, SA 2017-2019 |
| The latest update to JOLTS is no doubt being absorbed by the various members of the FOMC. We already know they will continue to say the labor market is strong, leaving just the unemployment rate to do the heavy lifting for them in public. Internally, what the JOLTS series indicates is, yes, a furtherance to what is already a series of rate cuts.
The level of Job Openings was one of the very few data points in agreement with the unemployment rate. That it has now turned decidedly downward is significant beyond the levels on either end. JO now stands in direct contrast to the unemployment rate. For the month of August (JOLTS is one further behind the payroll reports), JO dropped to 7.05 million continuing the downward trend that now stretches to three-quarters of a year. But it’s not just the shift which is concerning at this juncture, more so the speed by which it changed from agreeing with Powell to abjectly denying his whole case. The rate of change is unlike anything since 2007-08. |
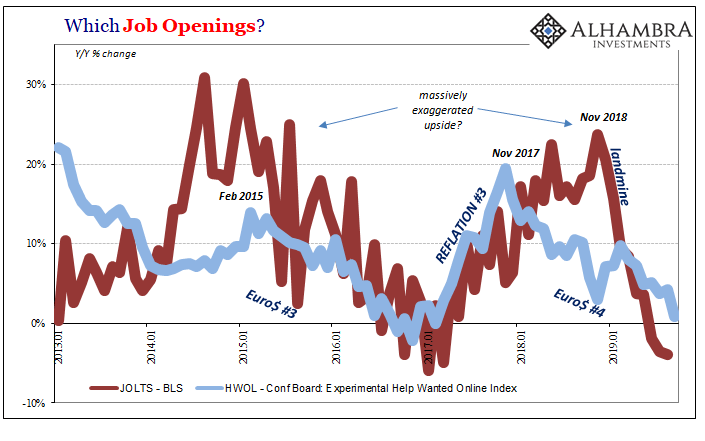
Which Job Openings? 2013-2019 |
| During Euro$ #3, for instance, it took the BLS’s JO series almost two years to transition from peak growth (Feb 2015) to finally bottoming out (Jan 2017). Meanwhile, Euro$ #4 timed perfectly to last year’s landmine has slammed JO from peak to near the same negative in a matter of just 9 months. And no bottom in sight.
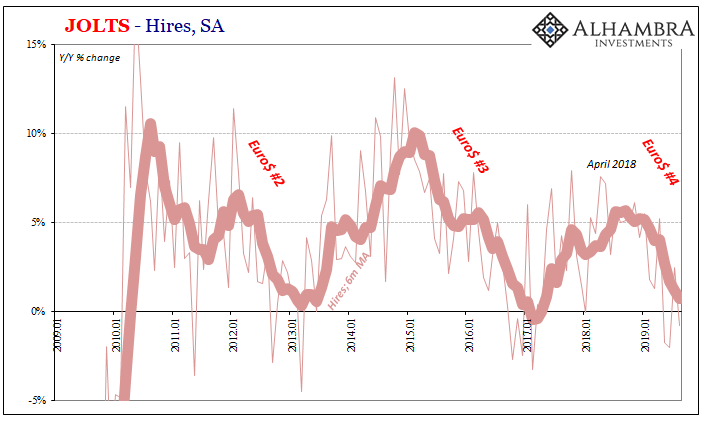
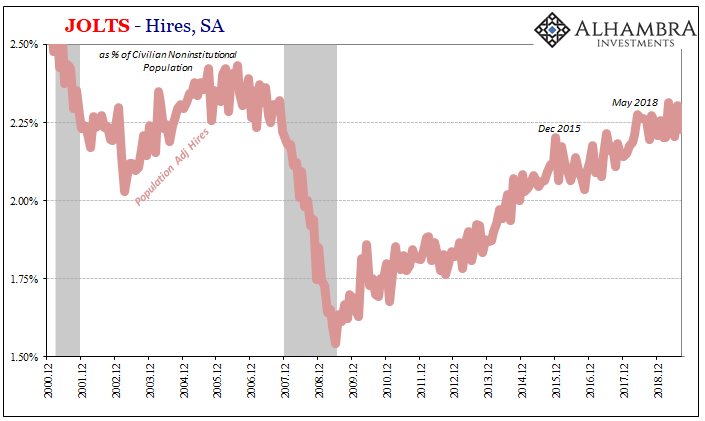
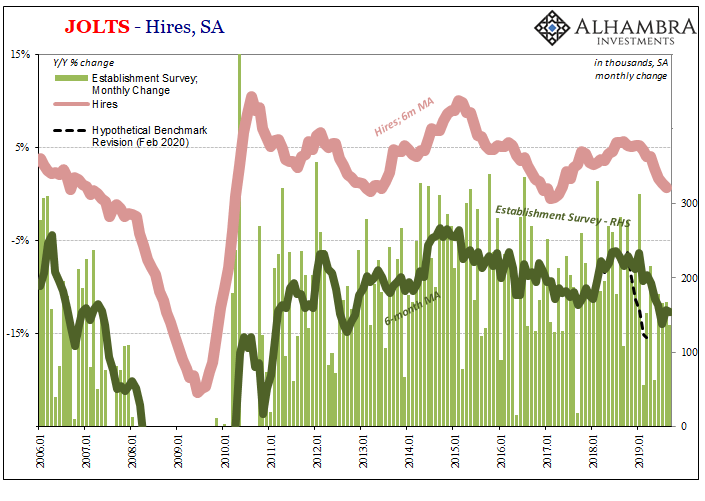
On the other side of JOLTS, Hires, companies have begun to reduce the rate of adding employees. The level of HI has been mostly sideways since May 2018, and now the annual comparisons are starting to turn negative. In August, HI was down 0.7% from August 2018, making three out of the last four months with minuses. |
JOLTS - Hires, SA 2009-2019 |
JOLTS - Hires, SA 2000-2019 |
|
JOLTS - Hires, SA 2006-2019 |
|
And what you see here is all the best-case scenario. I wrote last month about the looming benchmark revisions which will affect JOLTS, too:
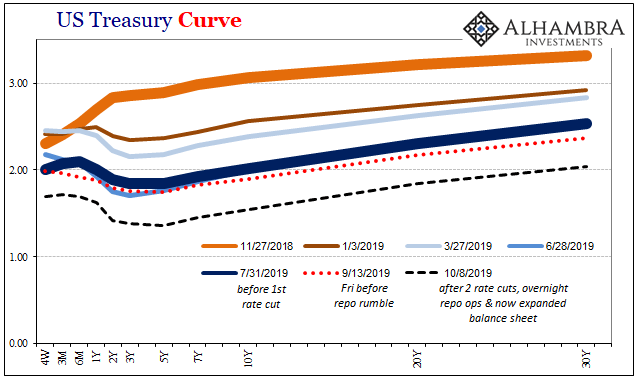
The levels of Hires and more importantly Job Openings are undoubtedly significantly weaker than they right now appear. And right now they already appear inconsistent with a mid-cycle adjustment. No wonder the bond market isn’t buying any of this. Liquidity risk, economic risk, and recalcitrant policymakers who feel that good monetary policy is to spin everything as strong and favorable no matter how much evidence piles up against the narrative. In fact, the worse it gets, and the more obvious, the more Powell will strenuously insist what he’s doing is not what he’s doing. |
US Treasury Curve, 2018-2019(see more posts on U.S. Treasury, ) |
Tags: Bonds,currencies,economy,Federal Reserve/Monetary Policy,hires,jay powell,job openings,jolts,Labor Market,Markets,newsletter,rate cuts,U.S. Treasury,unemployment rate


