


Shifting PatternsIn the last issue of Seasonal Insights I have discussed Bitcoin’s seasonal pattern in the course of a year. In this issue I will show an analysis of the returns of bitcoin on individual days of the week. It seems to me that Bitcoin is particularly interesting for this type of study: it exhibits spectacular price gains, it is a very new instrument and it is unregulated. Moreover, it trades around the clock, even on weekends. Given this setup, I found myself wondering: do prices rise uniformly? And does their performance on weekends differ from that on workdays? |
Bitcoin, daily(see more posts on Bitcoin, )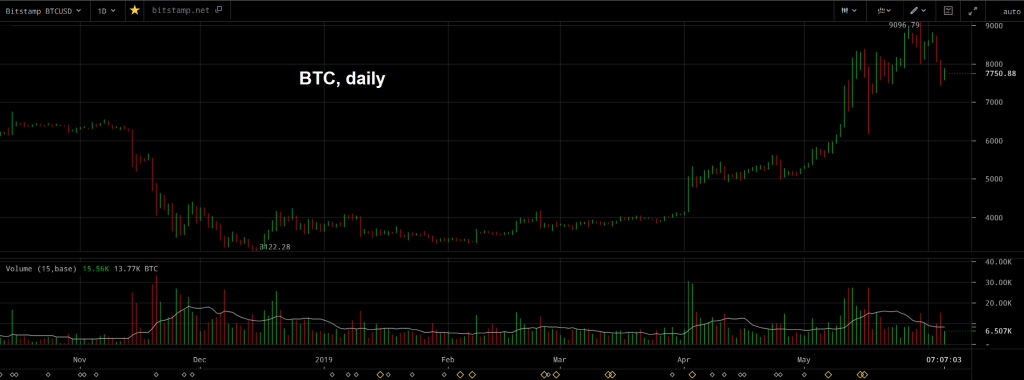 Bitcoin, daily – since bottoming in early December, BTC has advanced quite a bit. It remains an excellent trading sardine. [PT] - Click to enlarge |
Bitcoin: The Action Mainly Takes Place at the Beginning of the WeekThe first chart below shows the annualized performance of bitcoin since 2011 in black, as well as the cumulative annualized performance on individual days of the week in blue. Note: due to the extent of the rally to date, the compounding effect is particularly strong; the average cumulative returns achieved on individual days of the week therefore don’t add up linearly to the total annualized return of bitcoin. In order to improve the clarity of the illustration, I have inserted a break in the black column and the scale of the y-axis. As the chart shows, the beginning of the week is standing out noticeably: if one had invested exclusively on Mondays, an annual return of 27.53 percent would have been attained. The cumulative gain achieved on Tuesdays was even stronger at 39.88 percent! By contrast, the average return of 7.71 percent achieved on Friday was fairly small. Moreover, Saturdays, and by the standards of bitcoin also Sundays and Wednesdays, were rather boring days as well. Next we will take a look at the detailed evolution of these trends over time. |
BTC average daily performance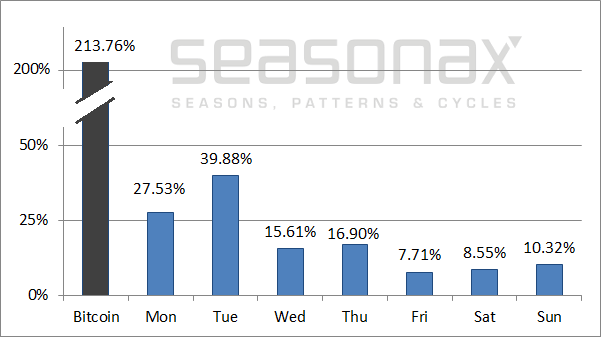 Bitcoin, performance by individual days of the week, 2011 to 2019. In the long-term, the strongest gains were achieved at the beginning of the week - Click to enlarge |
The Days of the Week under the Magnifying GlassThe next chart shows the performance of bitcoin since 2011 in black, as well as the cumulative return achieved on every individual day of the week in other colors – indexed to 100. As the chart shows, Tuesday (yellow line) was well ahead of the pack from the very beginning.. However, if you look more closely, you can see that the pink line representing Friday is rising particularly strongly since 2016. Along with the rising popularity of Bitcoin, the intraday pattern has changed. In the rally in recent months the pink line representing Friday (which was recently hidden behind the purple line) was able to keep pace. Thus it made more sense to buy on Friday morning rather than on Sunday morning during the recent upward move. |
BTC days of the week cumulative, 2011-2019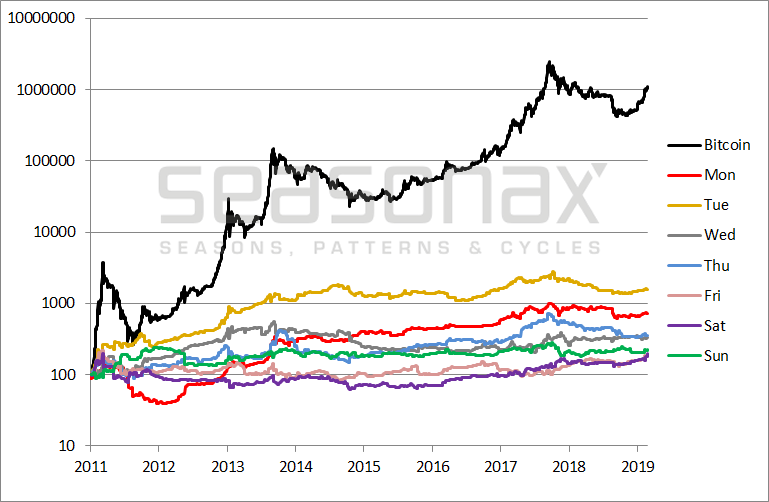 Bitcoin, cumulative returns by day of the week, 2011 – 2019, indexed. Saturday is catching up - Click to enlarge |
The Case of Bitcoin Highlights That There are Market Discrepancies one can Take Advantage Of
What do the statistical anomalies in Bitcoin tell us generally about investing in financial markets?
Contrary to what some theories assert, efficient markets do not exist in the real world. Human habits, regulations or manipulation can result in recurring disparities in price patterns. Discrepancies such as those in bitcoin discussed above and many other such patterns can be quickly found with the help of the Seasonax app on the internet at www.app.seasonax.com or on Bloomberg or Thomson-Reuters systems; they exist in stock markets, currencies and commodities as well. Don’t let the disciples of the efficient market hypothesis keep you from taking advantage of them in your investment practice!
PS: The strength of Bitcoin at the beginning of the week is symptomatic of market discrepancies that can be exploited!
Charts by cryptowat.ch, Seasonax
Chart captions by PT where indicated
Full story here Are you the author?Tags: Bitcoin,Crypto - Currencies,newsletter


